
After years of exponential growth, our eCommerce journey hit a wall. No matter how hard we pushed, growth seemed harder to achieve with each passing month. It took me years to uncover the real drivers of sustainable growth—this story will change the way you look at your brand forever.
We tried countless marketing twists, each bringing brief success, fading out as soon as the new concept wore out. It felt like an endless cycle of chasing short-lived wins. After months of trial and error, we had a breakthrough—one that changed everything. Fast forward five years, and we’ve scaled our Shopify store to over $100 million in revenue and $30 million profit.
This is the story of how we did it—and how you can, too.
My Story
Budgets were tight, quick results were demanded, yet we knew deep down that customer quality was the key to long-term success. Our numbers told the story: 72% of our revenue came from just 20% of our customers.
To fuel short-term growth we launched aggressive customer acquisition campaigns, resulting in low-quality customers. Pressure from high inventory levels compounded the problem. Although we had it on our agenda, many internal stakeholders pushed back, arguing that we couldn’t afford to focus on customer quality. Instead, we needed to sell fast, clear out inventory, and build up cash reserves.
But the truth was we weren’t building sustainable growth. It felt like we were merely shifting money from one month to the next without creating real, incremental value. So I started building a simple Google spreadsheet to model what would happen if we shifted our strategy. The results were surprising: the success of our business hinged on just a handful of critical factors:
Repeat Purchase Rate
Average Order Value
Product Returns
All three metrics share a common trait—they are the key drivers of the north star metric Customer Lifetime Value (LTV).
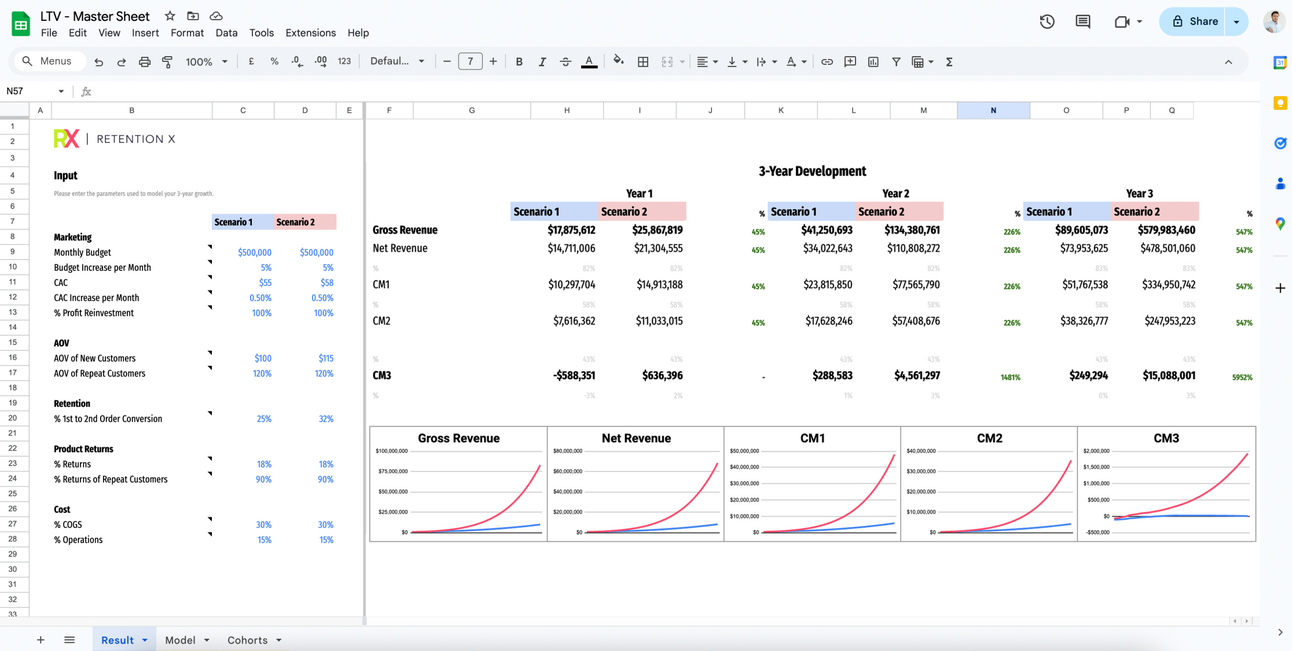
Sharing is caring: Just make a copy and plug in your own data.
Understanding the importance of LTV, I took immediate action:
Cut Unprofitable Sales: Some customers had terrible unit economics. Their incremental revenue didn’t even cover the cost of goods sold.
Budget Strategically: We allocated budgets to support the strategy shift, while ensuring clear visibility into how quickly the investment would pay off.
Focus on Profit Drivers: We redirected spending toward initiatives with a direct impact on profitability.
I’ll dive into how we put these actions into practice later.
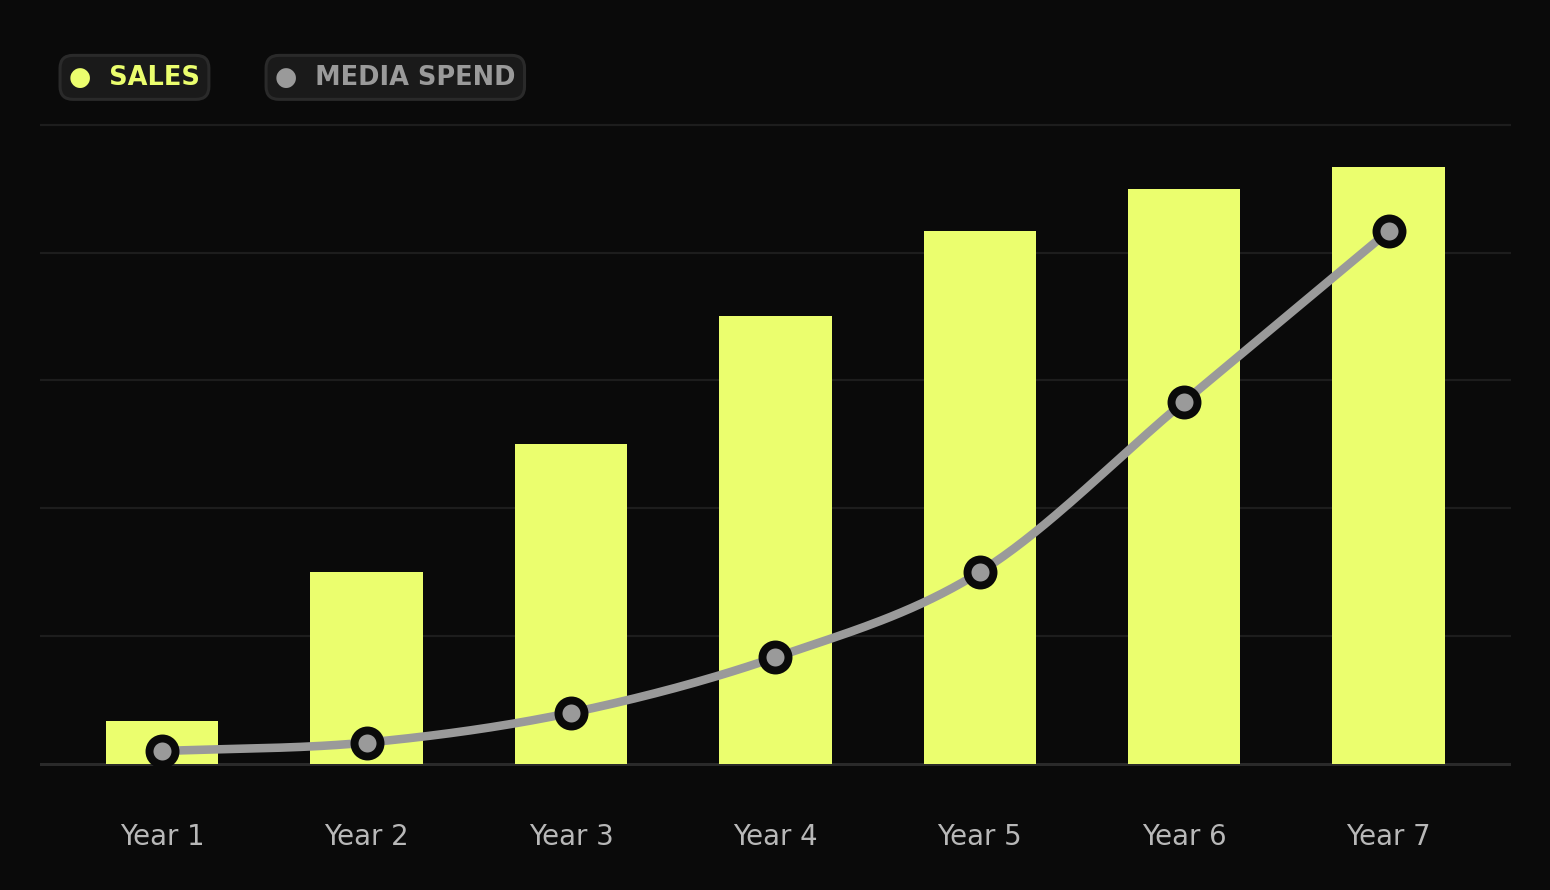
The shift in strategy didn’t just promise long-term gains—it delivered. Within 6 months, we began to see positive results. After one year, our top-line revenue was up 30%, but more importantly, our bottom-line profit had improved by 80%. By year three, the business had transformed into a completely different company!
The Magic Formula
There’s a lot of opinions about how LTV should be calculated. Different teams often push for numbers that serve their own goals. Marketers, for instance, tend to present LTV as cumulative gross revenue to justify larger budgets and higher customer acquisition costs. CFOs prefer to view LTV as net customer profit after all operational costs. Neither view serves to scale LTV.
Here’s my recommendation: The LTV of a customer should include all revenues and costs that the customer can actively influence through their behavior.
You might wonder about factoring in shipping costs to distant countries like Japan, which are higher than those to Canada. While this is true, it’s ultimately a business decision to sell to these countries—something beyond the customer’s control. Such factors should influence your pricing strategy, rather than expecting increased loyalty from a Japanese customer to achieve the same profitability.
On the flip side, discounts and product returns are absolutely essential in your LTV calculation. This is why LTV should be calculated on a CM1 (Contribution Margin 1) basis.
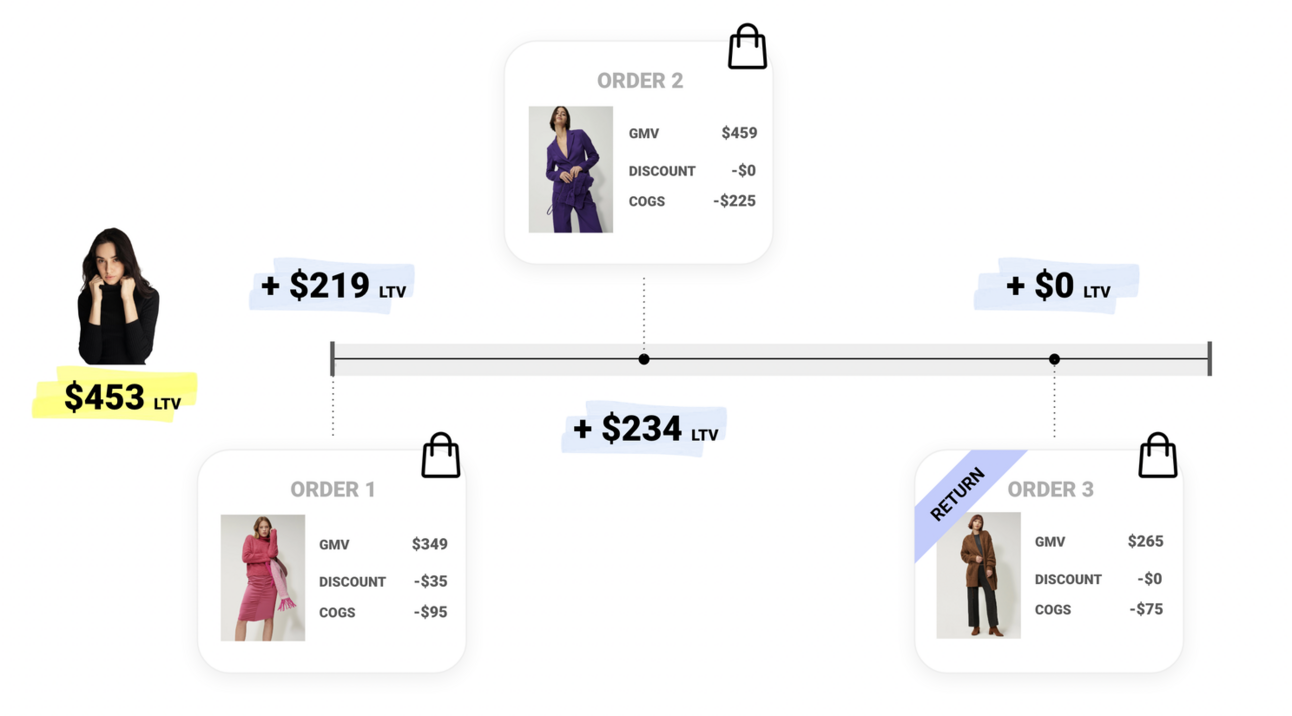
Here’s how to calculate LTV, step by step:
Gross Merchandise Value (after sales taxes) This is the total of a customer’s order values over time, excluding taxes. It increases with the customer’s average order value (AOV) and the total number of purchases made.
Discounts Deduct any discounts the customer received, including welcome coupon codes, reactivation discounts, or any other markdowns. This is the amount the customer actually paid after discounts.
Product Returns Especially for fashion brands, product returns are a critical factor. A customer with 10 orders and a 90% return rate will cost you far more than a customer who places just one order with no returns. Returns create additional overhead—from shipping costs to handling and restocking, not to mention the impact on marketing spend.
Cost of Goods Sold (COGS) The true value of a customer is only evident after accounting for COGS, which includes production costs or the item’s purchase price. COGS are crucial for expressing gross margins, especially when discounts are applied to orders. As discounts reduce revenue while COGS remain unchanged, the gross margin decreases, significantly impacting LTV.
The resulting value is the profit per customer over their lifetime: the LTV.
The Time Frame
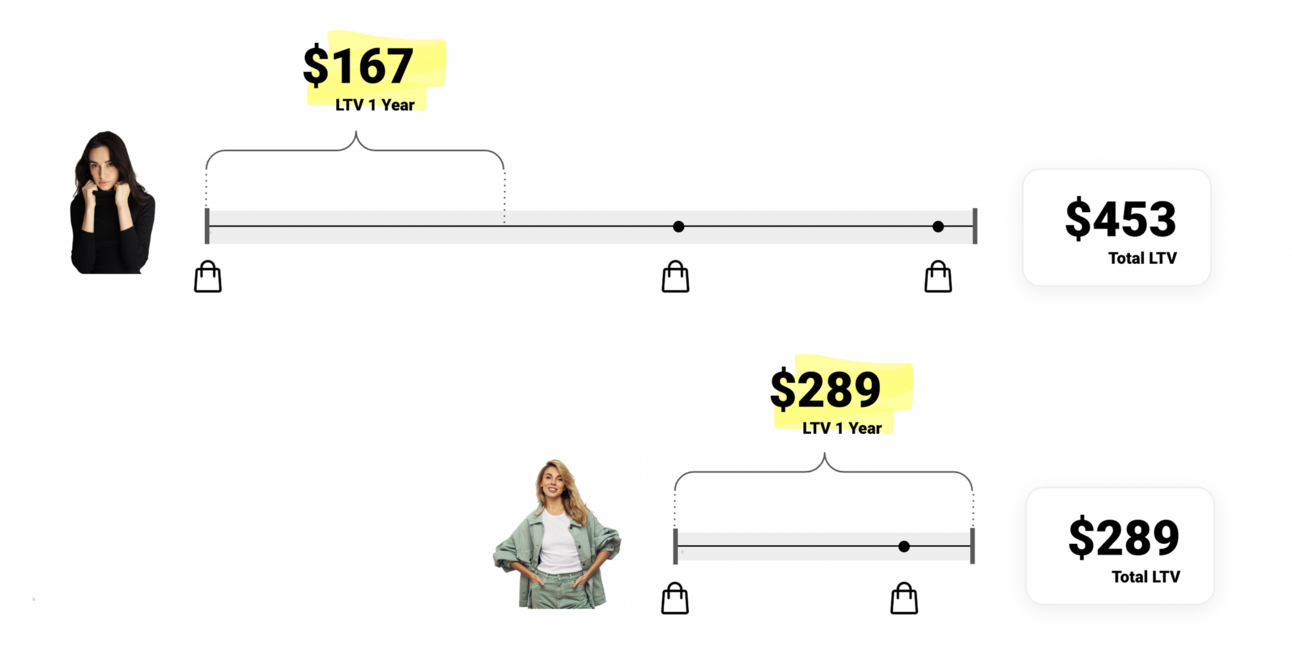
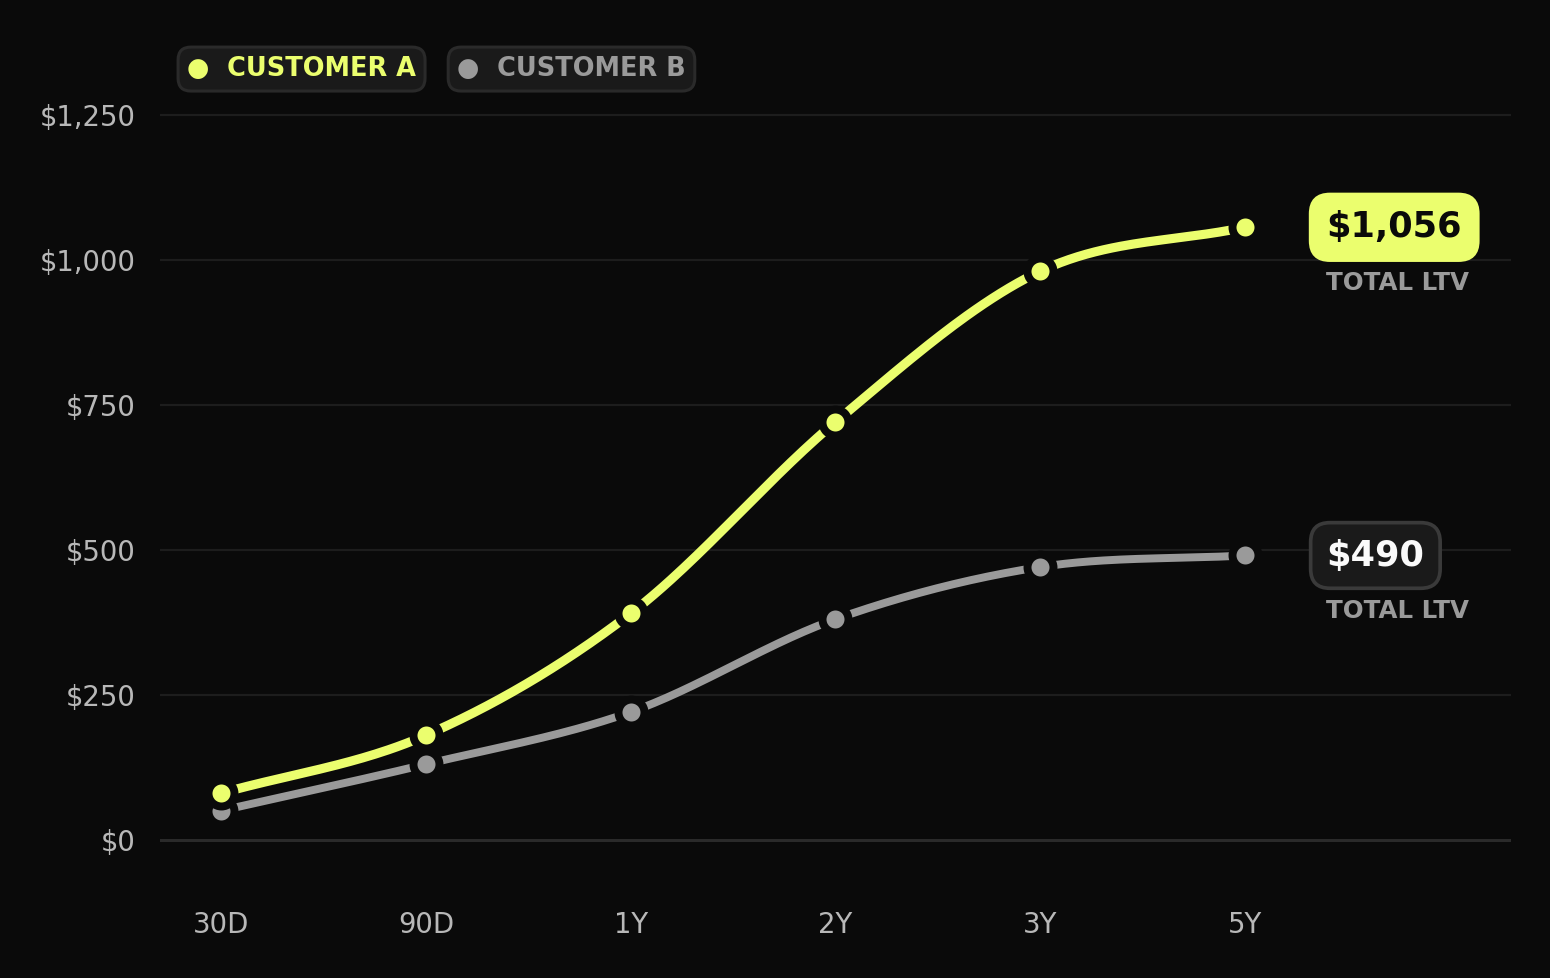
Another important factor when discussing LTV is time! Brands are often asked, "What is your LTV? This simple sounding question should never be answered with a single number. LTV is time-dependent! Because there's an inherent time component to the calculation and its tendency to evolve over time, context is key. A correct answer to this question would be something like, "After the first year, the average LTV of our customers is $250.
Why? Customers acquired a year ago had much more time to build up high LTVs than new customers from this month. To create fair conditions, you need to base the calculation on a period that all the customers included have completed.
By simply averaging all of your customers' individual LTVs, you would be giving the LTVs of new customers the same weight as those of loyal customers, which would likely lower your overall number - especially during scaling periods when you're acquiring a high volume of new customers.
Time frames used by consumer brands to measure LTV are typically 1, 3, 12, 24, and 60 months.
Okay, so now we know what to look for. But why are we doing this, and what is the expected result?
The Impact
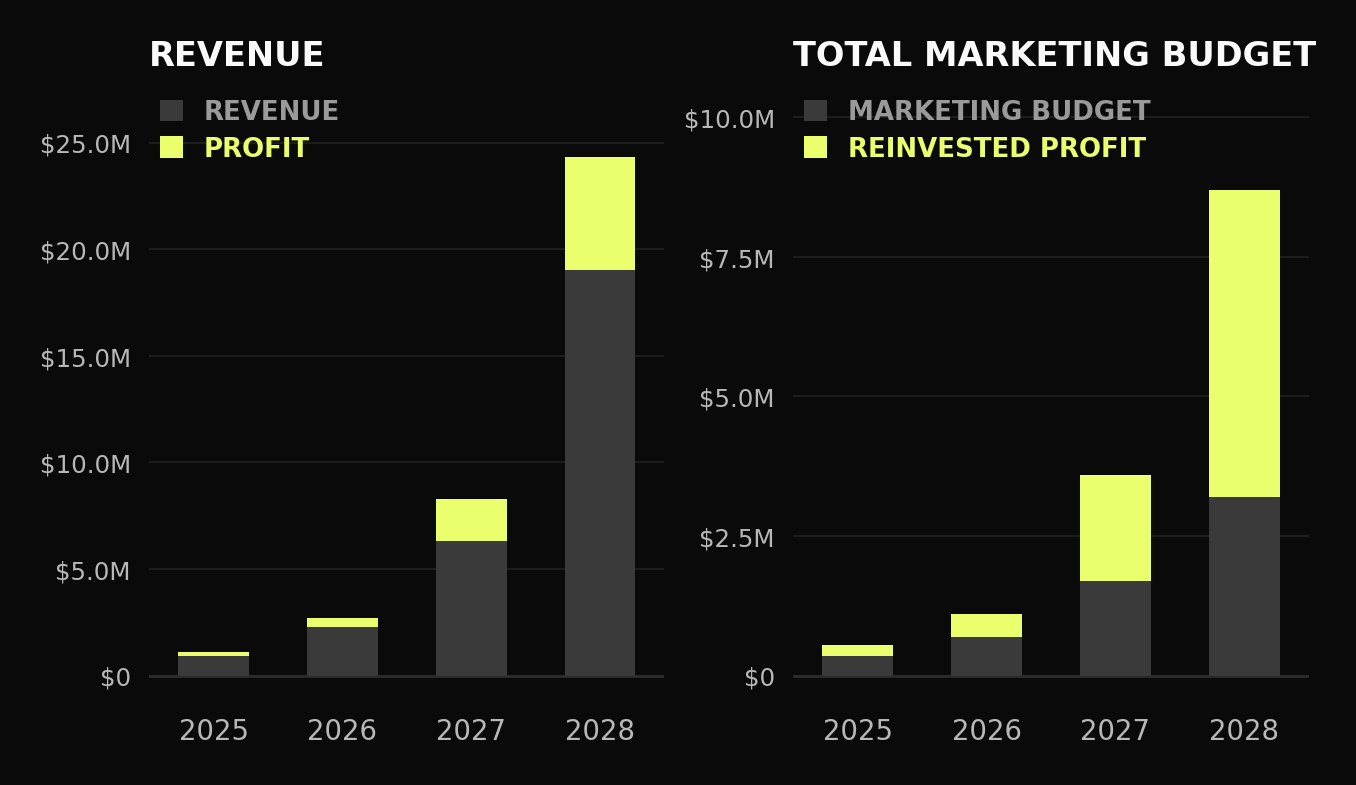
It’s simple: increasing your LTV by just 10% can result in 50% more net profit. This additional profit can be reinvested directly into faster growth, creating a compounding effect. Successful brands leverage this dynamic to scale even faster—they earn more per customer and use that extra cash to fuel further expansion.
At the same time, improving LTV reduces operational costs across the board. Serving fewer but higher-quality customers means less strain on customer service teams and fewer product returns. It allows your service team to focus on higher-value activities—like upselling or building stronger relationships with premium customers—instead of dealing with issues like fraud and chargebacks.
Success hinges on achieving the right balance between acquiring new customers and maximizing their lifetime value. A crucial metric that helps assess this balance is the LTV:CAC ratio—a key indicator of the efficiency and sustainability of a brand's growth strategy.
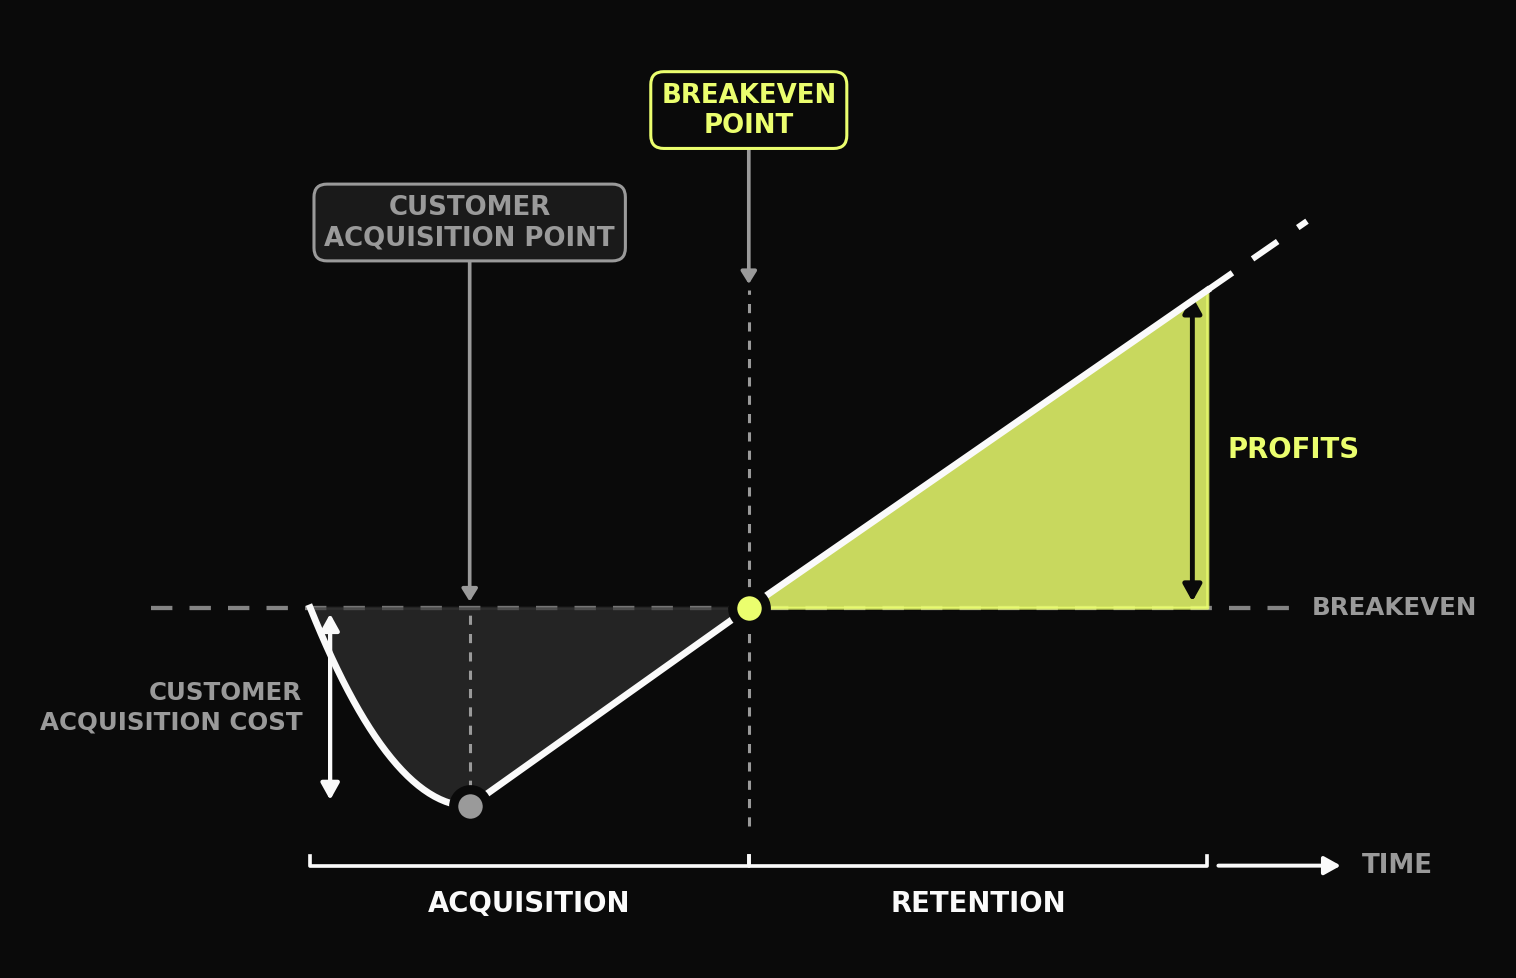
The LTV:CAC ratio compares the value a customer generates during their lifetime to the cost of acquiring them. Let’s break it down:
Customer Lifetime Value (LTV): The profit a customer generates over their lifetime. This factors in purchase frequency, average order value, customer retention rate, and associated costs.
Customer Acquisition Cost (CAC): The total cost of acquiring a new customer, including marketing, advertising, and other related expenses.
This ratio provides a clear insight into your business’s acquisition efficiency and retention strategy. Here’s how to interpret different outcomes:
Ratio < 1.0: If the ratio is less than 1.0, the cost of acquiring customers exceeds their lifetime value. This signals a need to reevaluate acquisition channels, optimize marketing, or improve retention efforts.
Ratio = 1.0: A ratio of 1.0 means LTV equals CAC. While this might seem balanced, it’s insufficient for long-term growth. Aim for a ratio higher than 1.0 to ensure profitability and scalability.
Ratio > 1.0: A ratio greater than 1.0 indicates that LTV exceeds CAC. This is a strong sign of efficient acquisition and retention, contributing to sustainable growth and profitability.
The ideal LTV:CAC ratio varies by industry and business model, but most successful brands aim for at least 3:1 within two years. This means the lifetime value of a customer should be three times the cost of acquiring them. Achieving this ratio provides plenty of room for reinvestment, innovation, and scalable growth.
LTV and CAC can vary significantly based on factors such as AOV, retention rate, and the competitive landscape within your industry. However, one constant remains—repeat customers are every brand’s secret weapon:
20% higher AOV than first-time buyers.
10% lower return rate, reducing operational costs.
Twice as likely to repurchase, driving incremental growth.
Enough theory! Let's get hands-on and start optimizing your metrics for success.

 Listen on Spotify