
Is LTV predetermined by your business model, or can you actively influence it? If so, how?
There are two approaches:
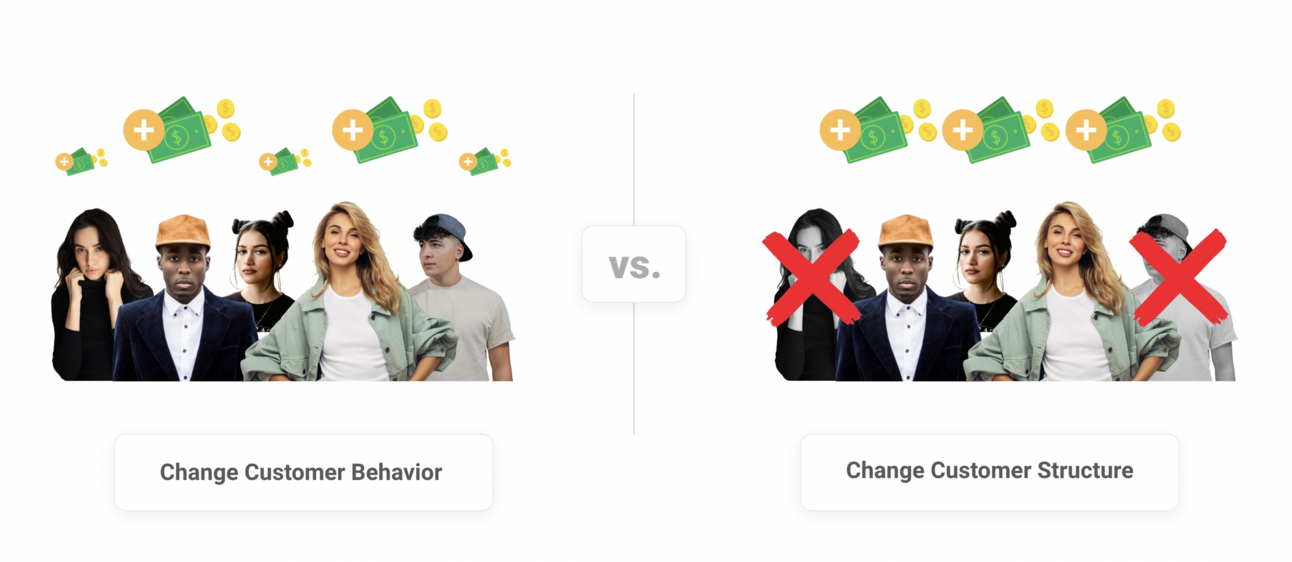
Change Customer Behavior This is more challenging but focuses on encouraging customers to make more frequent or higher-value purchases or remain loyal for longer.
Change Customer Structure This is simpler and consistently effective. By altering the ratio of high-quality to low-quality customers within your customer base, you naturally improve overall LTV—without needing to modify individual customer behavior.
I’ve compiled a list of actions that directly impact LTV, clustered by each key driver:
Change Customer Behavior
More Items per Basket
There are numerous proven tactics to increase the number of products per shopping cart. Here are some detailed guides on how to achieve this:
Higher Item Value per Basket
The most common issue, especially for more established brands, is the lack of a clear pricing strategy for bestseller positioning. The bestseller is typically the most prominently advertised product for customer acquisition. However, few brands consider where this product fits within the overall pricing structure. Often, the bestseller is priced significantly lower than other products in the portfolio. Many brands make the mistake of assuming that loss leaders are the key to reducing customer acquisition costs. However, this is usually a mistake. While it may improve CAC in the short term, it overlooks the long-term impact on LTV. I've written a full article on this effect here.
Better Repeat Purchase Rate
The overall repeat purchase rate highly depends on how many new customers make a second purchase. In particular for apparel brands, it’s important to understand that a product exchange does not count as a second purchase—swap order recognition is essential. So, what strategies can help encourage the second purchase? I’ve identified three key factors:
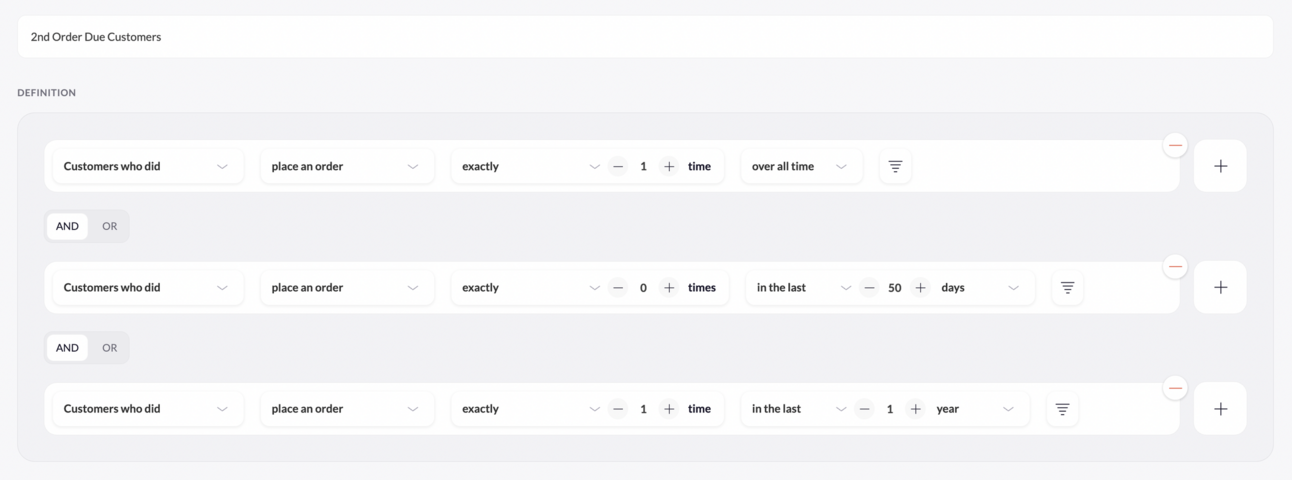
Timing: It's crucial to find the ideal time to reach out, tailored to the customer segment. When using incentives like coupon codes, be careful not to offer them too early, as it could prevent a full-price order. A good strategy is to analyze the median time between orders for specific products or categories.
Target Group: Proper segmentation is key. Who should receive communication, and where are they in their customer journey? Are they receptive to discounts? What’s their return behavior, and what’s the typical size of their basket? The more precise you are in segmenting customers, the better you can personalize communications and content. Striking the right balance between personalization and operational efficiency is critical.
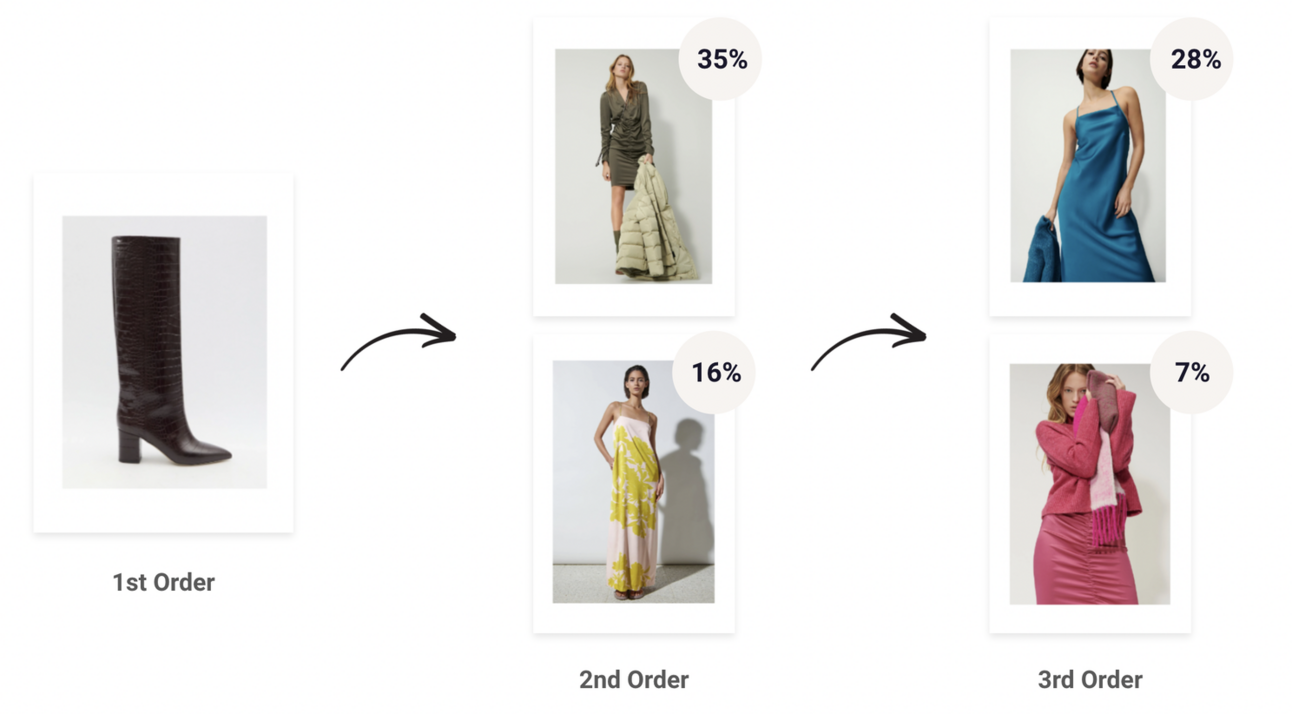
Content: Understand the ideal next best offer for the second purchase based on previous buying behavior. By analyzing repeat purchases, you can discover what customers tend to buy in their second purchase after purchasing specific products in their first.
Reduce Discounts
To maximize profitability and avoid eroding your brand value, carefully evaluate when and how you offer discounts.
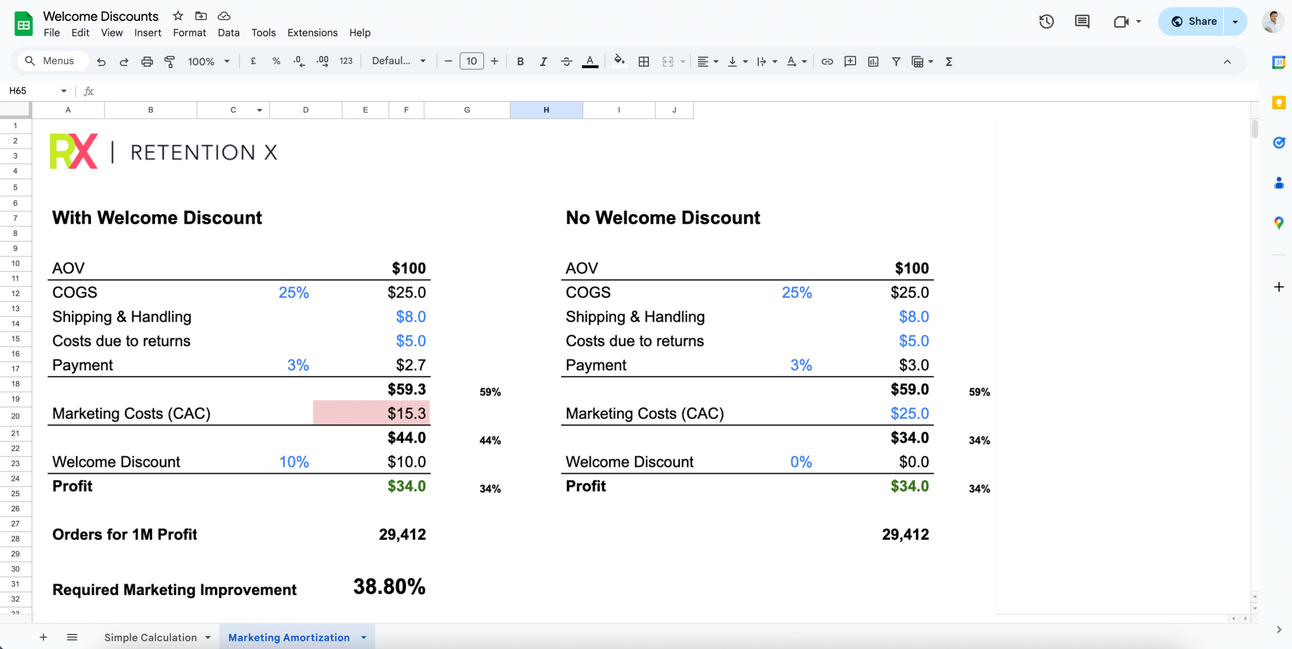
Re-evaluate Welcome Discounts: Keep in mind that offering a 10% welcome discount requires 30% more orders to achieve the same profit. Don't believe me? Read my post here and try it yourself.
Timing of Discounts: I refer to this as the forgotten long tail. Offering discounts too early can severely impact your bottom line. If your average customer repurchases within 30 days, it's likely that 60% of customers will place their order after that period. Giving a 15% discount to all customers could have a significant negative impact on profits.
Offer Samples: For beauty, nutrition, and health brands, offering samples can be a powerful way to introduce more products to consumers. This approach offers several benefits: it increases the likelihood of customers becoming regular buyers of a specific product line (leading to higher repeat purchases), enhances brand loyalty, and improves product penetration. Customers who receive free samples with their orders are up to 50% more likely to make repeat purchases within three months.
Be Sensitive to Full-Price Buyers: Reduce discount and sale communications to customers who are accustomed to buying at full price. Offering discounts to these customers not only eats into profits but also dilutes the perceived value of your brand. Luxury brands have long understood this: there is a segment of customers who prefer to avoid sales and care about the prestige of the brand they wear. Many brands have suffered lasting damage to their image from aggressive outlet strategies and have spent years rebuilding their reputation.
Reduce Product Returns
Product returns are a significant cost for many brands, impacting both profits and operational efficiency. By focusing on the root causes and taking targeted actions, you can reduce returns, save money, and improve customer retention.
Exclude Heavy Returners: Many tips to reduce return rates overlook the most significant factor: problematic customers. US brands typically have a product return rate of 24.4% – that doesn’t mean every fourth product is returned. In fact, 80% of customers don’t return anything, 20% return everything, and 5% return occasionally. This highlights the issue with relying solely on averages rather than examining distributions.
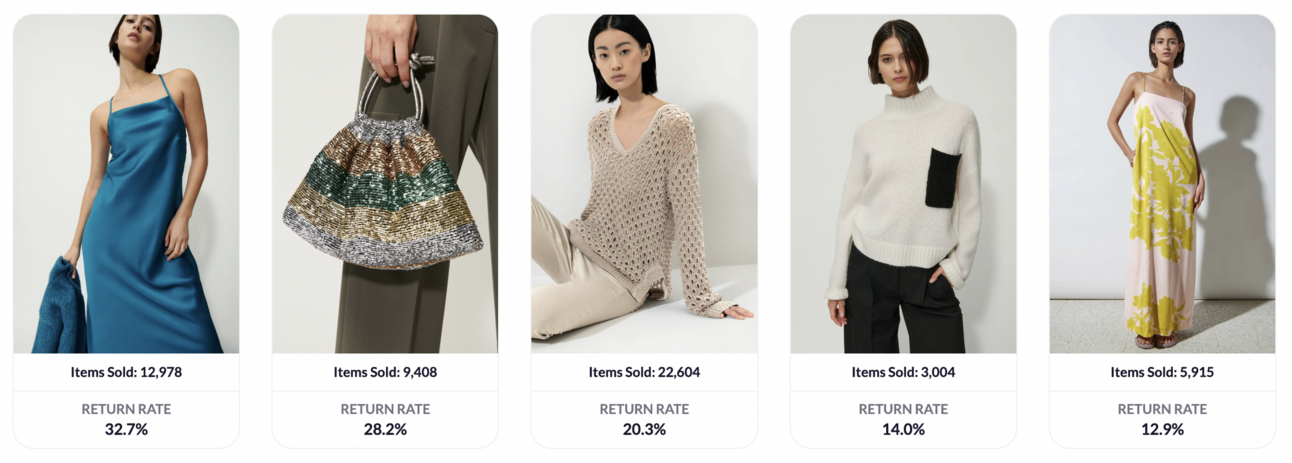
Analyze Products with High Return Rates: Stop promoting products that appear to have low customer acquisition costs but are frequently returned. This creates huge discrepancies: while your marketing team may report low acquisition costs, you’re losing substantial profits due to returns. Not only are marketing dollars wasted, but processing returns also incurs additional overhead costs.
Encouraging Exchanges: Promoting exchanges over returns can save money and increase customer retention. Here’s how to implement this strategy effectively.
Be Sensitive to Full-Price Buyers: Reduce discount and sale communications to customers who are accustomed to buying at full price. Offering discounts to these customers not only eats into profits but also dilutes the perceived value of your brand. Luxury brands have long understood this: there is a segment of customers who prefer to avoid sales and care about the prestige of the brand they wear. Many brands have suffered lasting damage to their image from aggressive outlet strategies and have spent years rebuilding their reputation.
Change Customer Structure
Optimizing LTV requires a deep understanding of your customer structure. Analyze key segments and adjust strategies based on specific attributes that drive higher loyalty, repeat purchases, and ultimately improve LTV.
Product & Category
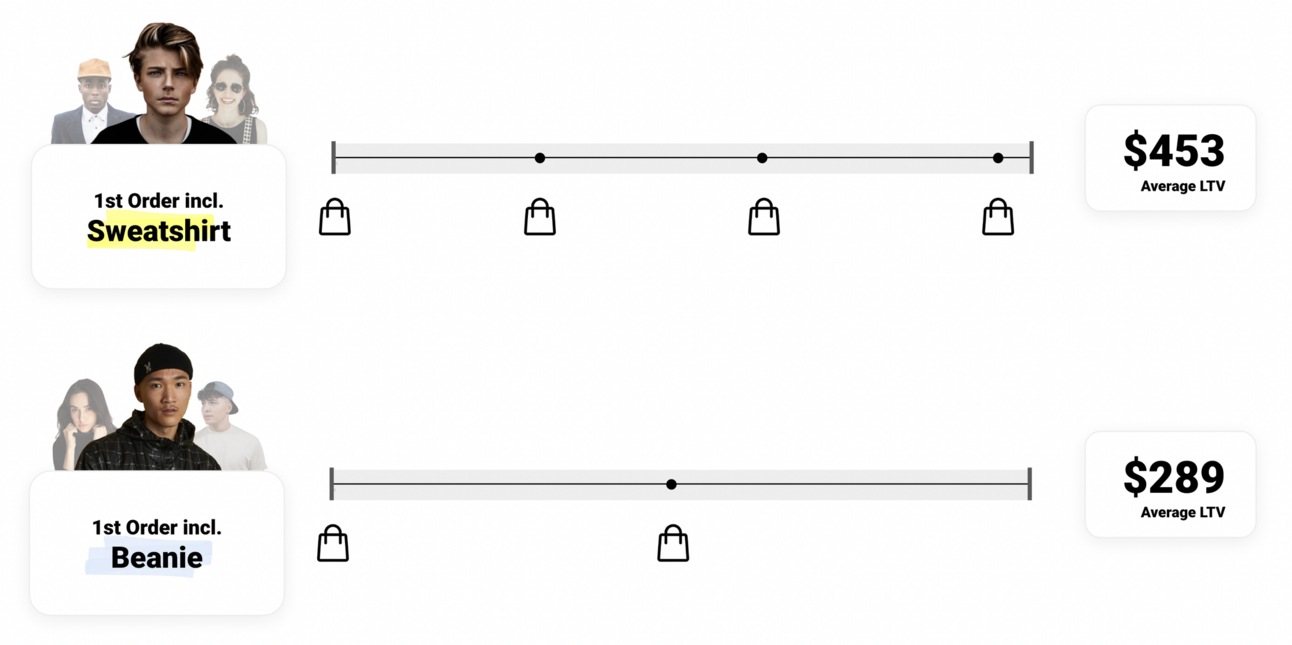
Every product journey is different and often defined by the first item a customer buys. Certain items lead to higher customer loyalty and repeat purchase rates, with more expensive initial products often resulting in better return rates. This highlights the importance of your pricing strategy for promoted products. If you lack product-level data, analyzing LTV by category can provide valuable insights.
Location
There is a strong correlation between the Buying Power Index (BPI) and LTV. By identifying key cities for marketing focus, you can increase customer LTV by as much as 82%, allowing you to justify higher acquisition costs in high-value areas while cutting back on low-value cities.
Marketing Journey
Many marketing platforms, such as Meta and Google, focus on first-purchase ROAS, but overlook LTV, especially when factoring in returns and discounts. This can lead to misjudgments about the effectiveness of campaigns and channels. Some may seem less cost-effective but result in better customer quality. Optimizing solely for CAC without considering the resulting LTV is one of the top mistakes marketers make.
Gender
Leverage gender predictions to identify key differences in buying behavior between men and women. This data enables you to target the opposite gender during key gift-buying periods, boosting sales.
Incentives
Understanding which types of incentives—such as a percentage off vs. dollar off—best affect LTV is critical. Analyze the impact of different coupon strategies, considering factors like repeat purchases, gross margin, and the total discount given.
TIP: I know that’s a lot to take in! I’ve been in the same position—feeling overwhelmed about where to find the data, how to get started, and how to embed an LTV-driven mindset into my teams. That’s why we built RetentionX. As a brand operator, it has been my #1 internal tool to turn things around before launching it as publicly available software.

 Listen on Spotify