12-Month LTV · Source of Truth
Your 12-month LTV sets your max CAC.
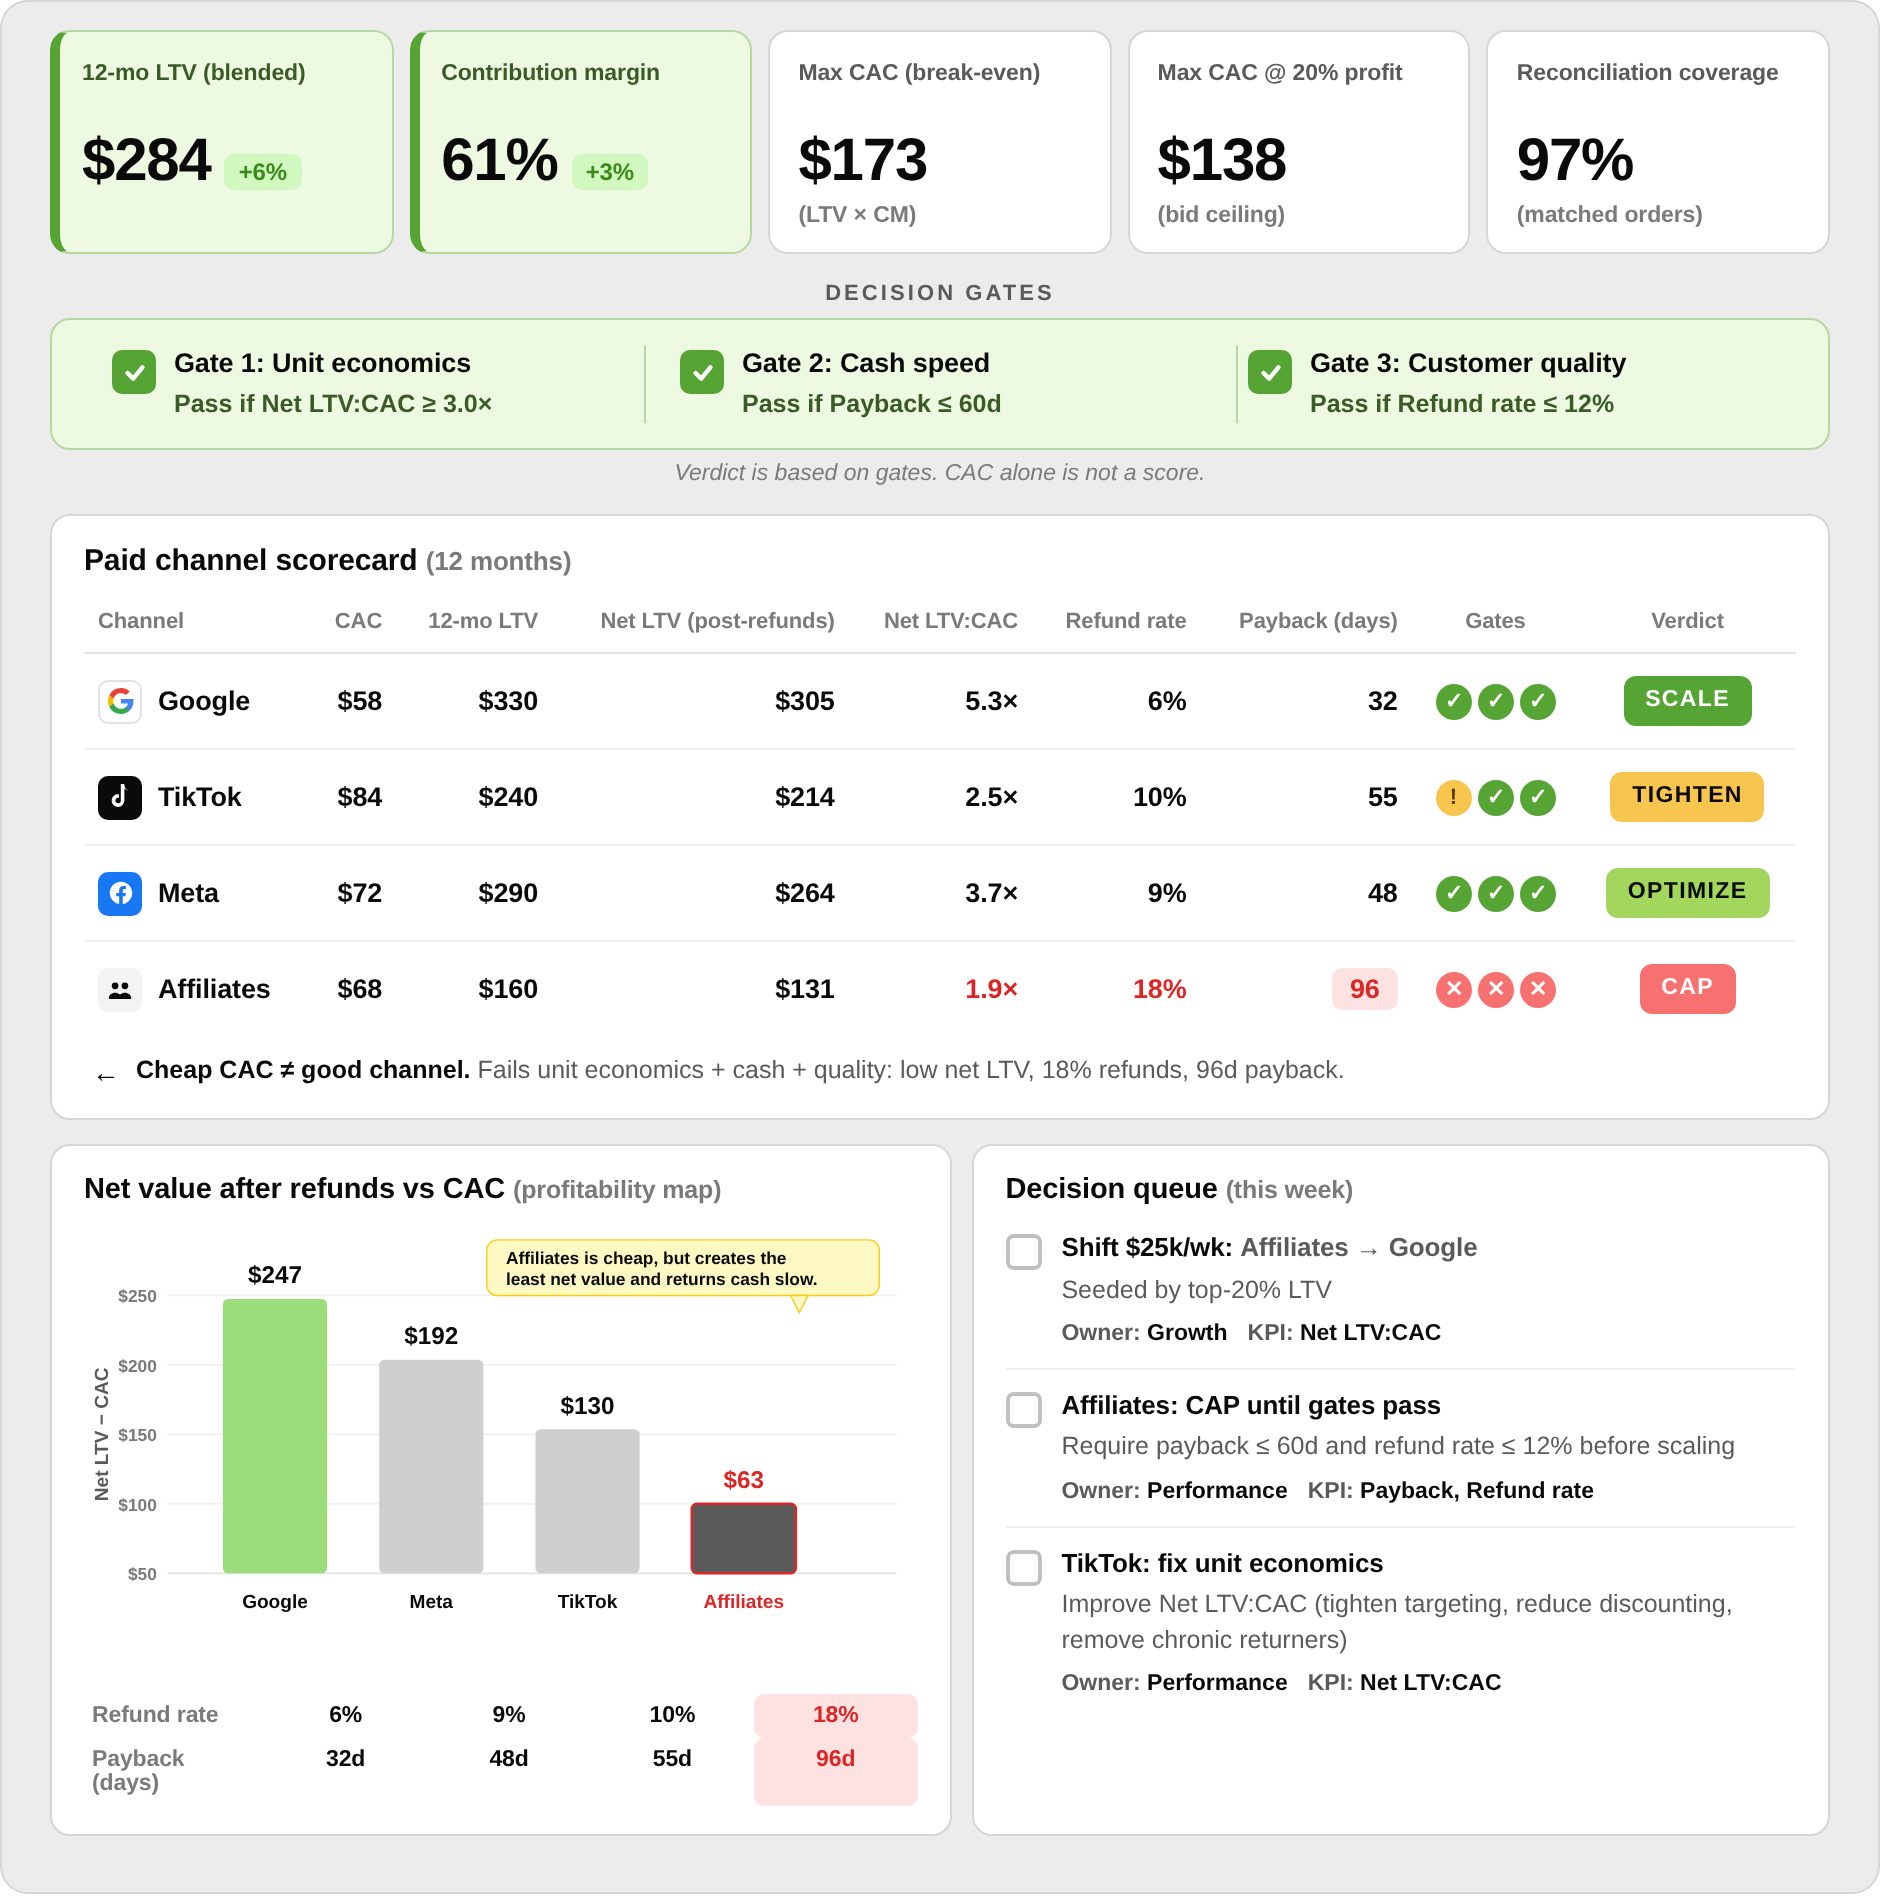
But the decision is gated by cash + quality — not the cheapest CAC.
You can know yesterday’s revenue and last week’s ad spend and still have no idea which customers are actually creating value over time. That gap is expensive because it leads you to scale bad channels, underfund good ones, and mistake activity for progress.
The brands that scale cleanly know their 12-month contribution-margin LTV by channel, cohort, and segment – and they use it to decide where growth deserves capital.
The five-tab problem
Here’s what this usually looks like inside a real brand.
The paid team is in ad managers looking at CAC and ROAS.
Finance is in the P&L looking at margin, refunds, and cash.
CRM is in the ESP looking at repeat behavior.
Ops sees rising shipping and return drag.
Leadership is trying to decide what to scale.
One channel looks great because CAC is low. Another looks expensive on day one. A third has strong volume but feels messy. Everyone has a piece of the story. No one has the full one.
Suddenly the cheapest channel is no longer the best channel. It might be bringing in customers with: lower 12-month net LTV, higher refund rates, slower payback & weaker repeat behavior.
Meanwhile, the "more expensive" channel turns out to be the one creating customers who repay CAC quickly and keep buying at full price.
That is the moment the business stops making marketing decisions and starts making capital allocation decisions.
My learnings
Revenue is not customer value: A $100 first order is not the same as a $100 customer. Real value only appears when you account for discounts, refunds, shipping, COGS, and repeat behavior over time. If your LTV is still a topline number, you’re not measuring value. You’re measuring gross activity.
Blended LTV is not enough: Saying "our 12-month LTV is $X" at the company level is a starting point, not a decision system. The only version that matters operationally is 12-month LTV by channel, segment, cohort, and first-purchase product. That is where you learn which growth is compounding and which growth is leaking.
CAC is not a score: A channel with the lowest CAC can still be the worst channel if it fails on unit economics, cash speed & customer quality.
That means you should never judge paid performance on CAC alone. You need a gate system that asks whether the customer is profitable enough, fast enough, and clean enough to deserve more spend.
The brand with the better source of truth will outbid the brand with the better dashboard: If your competitor knows which cohorts create stronger 12-month profit LTV, they can rationally pay more for the right customers while you keep optimizing for the cheapest conversion. That’s how smart operators win markets that look "too expensive" to everyone else.
|
✓
|
|
The Operator Playbook
|
| What to actually change |
| Five operator moves to turn your LTV view into decisions, not debate. |
|
|
|
|
Build one reconciled 12-month LTV view.
Stop stitching together separate truths from paid, Shopify, CRM, and finance every time there’s a decision. One table that shows, at minimum:
| • |
CAC |
| • |
12-month revenue |
| • |
12-month net LTV after refunds |
| • |
Contribution margin |
| • |
Payback days |
| • |
Refund / return rate |
If the business can’t see those in one place, it can’t allocate budget intelligently.
|
|
|
Add decision gates to every channel review.
Don’t ask only “What was CAC?” Ask whether the channel passes three gates:
| • |
Unit economics: does Net LTV:CAC clear your threshold? |
| • |
Cash speed: does payback stay inside your safe window? |
| • |
Customer quality: are refund rates and repeat behavior acceptable? |
Thresholds vary by category. The principle does not: scale only when all gates pass.
|
|
|
Score channels on net value after refunds vs CAC.
A channel can look efficient on the front end and still create the least net value once refunds, margin, and payback are accounted for. You want a scorecard that ends in decisions:
| • |
Scale |
| • |
Optimize |
| • |
Tighten |
| • |
Cap |
That language forces action instead of debate.
|
|
|
Break it down by the variables that actually change customer quality.
Once the base model exists, split the data by:
| • |
New vs returning |
| • |
First-purchase product |
| • |
Offer type |
| • |
Campaign / audience |
| • |
Channel |
Often it’s not a whole channel that’s bad — a specific product, entry offer, or customer segment is poisoning the economics inside it.
|
|
|
Turn the source of truth into weekly operating decisions.
Most teams stop here. A good LTV view should drive live decisions:
| • |
Shift budget away from low-LTV acquisition sources |
| • |
Change which product leads paid |
| • |
Suppress high-return customer groups from remarketing |
| • |
Tighten discount use where payback is stretching |
| • |
Lean harder into channels bringing high-quality cohorts |
In other words: not more analysis — better decisions.
|
|
|
BOOK YOUR AUDIT →
|
|
The takeaway
If you do not have one trusted answer to 12-month profit LTV, you are not really deciding what to scale — you are negotiating across tools. And once growth gets expensive, that is one of the fastest ways to waste capital.
Healthy scaling happens when you know which channels, products, and cohorts create value over time — and when that value shows up fast enough to fund the next round of growth. That’s why the best operators do not just report CAC and revenue. They reconcile LTV, margin, payback, and quality into one source of truth and run the business from there.
|
Reader questions
|
| Ask me anything. |
| Smart questions from operators in my inbox — my honest answers. |
|
|
What’s the MVP setup for a profit-based LTV view? |
|
|
|
|
Alex says · Founder RetentionX |
|
| MVP is one dataset that ties orders + customers + acquisition source to profit inputs (COGS, discounts, shipping/fulfillment, payment fees) and then tracks cohorts over time. You don’t need a perfect warehouse — just a consistent model you can refresh without five logins. Start with 90 / 180-day profit curves, then extend to 12 months as history accumulates. The goal is decision-grade truth, not accounting perfection. |
|
|
|
When you say “profit-based LTV,” what do you treat as non-negotiable inputs to be decision-grade: COGS, shipping/fulfillment, discounts, payment fees, returns? Anything you usually leave out at first? |
|
|
|
|
Alex says · Founder RetentionX |
|
| Non-negotiable: COGS, discounts, shipping/fulfillment, payment fees, plus returns/refunds (actual or expected). Those are the big levers that turn “revenue LTV” into reality. You can phase in smaller costs later (support, chargebacks, variable pick/pack nuance), but don’t wait for perfect granularity. If those core inputs are missing, you’ll systematically overpay for bad customers. |
|
|
|
Do you recommend using expected returns (modeled by SKU/category) so you can act in real time, or only actual returns once they land? I’ve seen teams get blindsided by return-heavy cohorts months later. |
|
|
|
|
Alex says · Founder RetentionX |
|
| Use expected returns for decisions, reconcile with actuals later. If you wait for returns to land, you’re blind while you scale spend. Model expected returns by SKU / category / segment, then update as reality comes in. It’s the only way to steer cohorts in-week instead of doing post-mortems. |
|
|
|
How do you handle “LTV by channel” without getting dragged into attribution wars? Is it best to assign each customer a primary acquisition source and then judge that cohort’s profit curve over 90 / 180 / 365 days? |
|
|
|
|
Alex says · Founder RetentionX |
|
| Exactly. Pick a consistent rule for “primary acquisition source” and then judge channels by the profitability of the cohorts they originate — not by who “touched” the conversion last. Attribution can still be used tactically, but budget allocation should be driven by cohort profit curves because that’s harder to politicize. The question isn’t “who gets credit,” it’s “who manufactures profitable customers.” |
|
|
|
Once you have the truth, what’s the first split that usually unlocks action: entry SKU, geo, discount affinity, or product category? Curious what most often explains why two channels with similar CAC create very different customers. |
|
|
|
|
Alex says · Founder RetentionX |
|
| The fastest unlock is usually entry SKU / category plus discount affinity. Channels can look identical on CAC but recruit very different customers because the entry product and offer shape intent. Geo can be a big second layer when buying power varies a lot. Once you see which entry paths create high-CM1 repeaters vs one-and-done promo buyers, channel decisions get much easier. |
|
|


 Listen on Spotify