
The timing of value matters as much as the value itself. A customer worth $200 over 12 months is not the same as a customer worth $200 over 3 years. Your cash flow, payback window, and appetite to scale depend on when contribution margin shows up — not just where it ends.
The mistake most teams still make
A brand walks into a planning meeting and says, “Our LTV is $210, so a $95 CAC is fine.”
That sounds disciplined. It isn’t.
Because the real question is not whether the customer gets to $210 eventually. The real question is how fast that customer gets there.
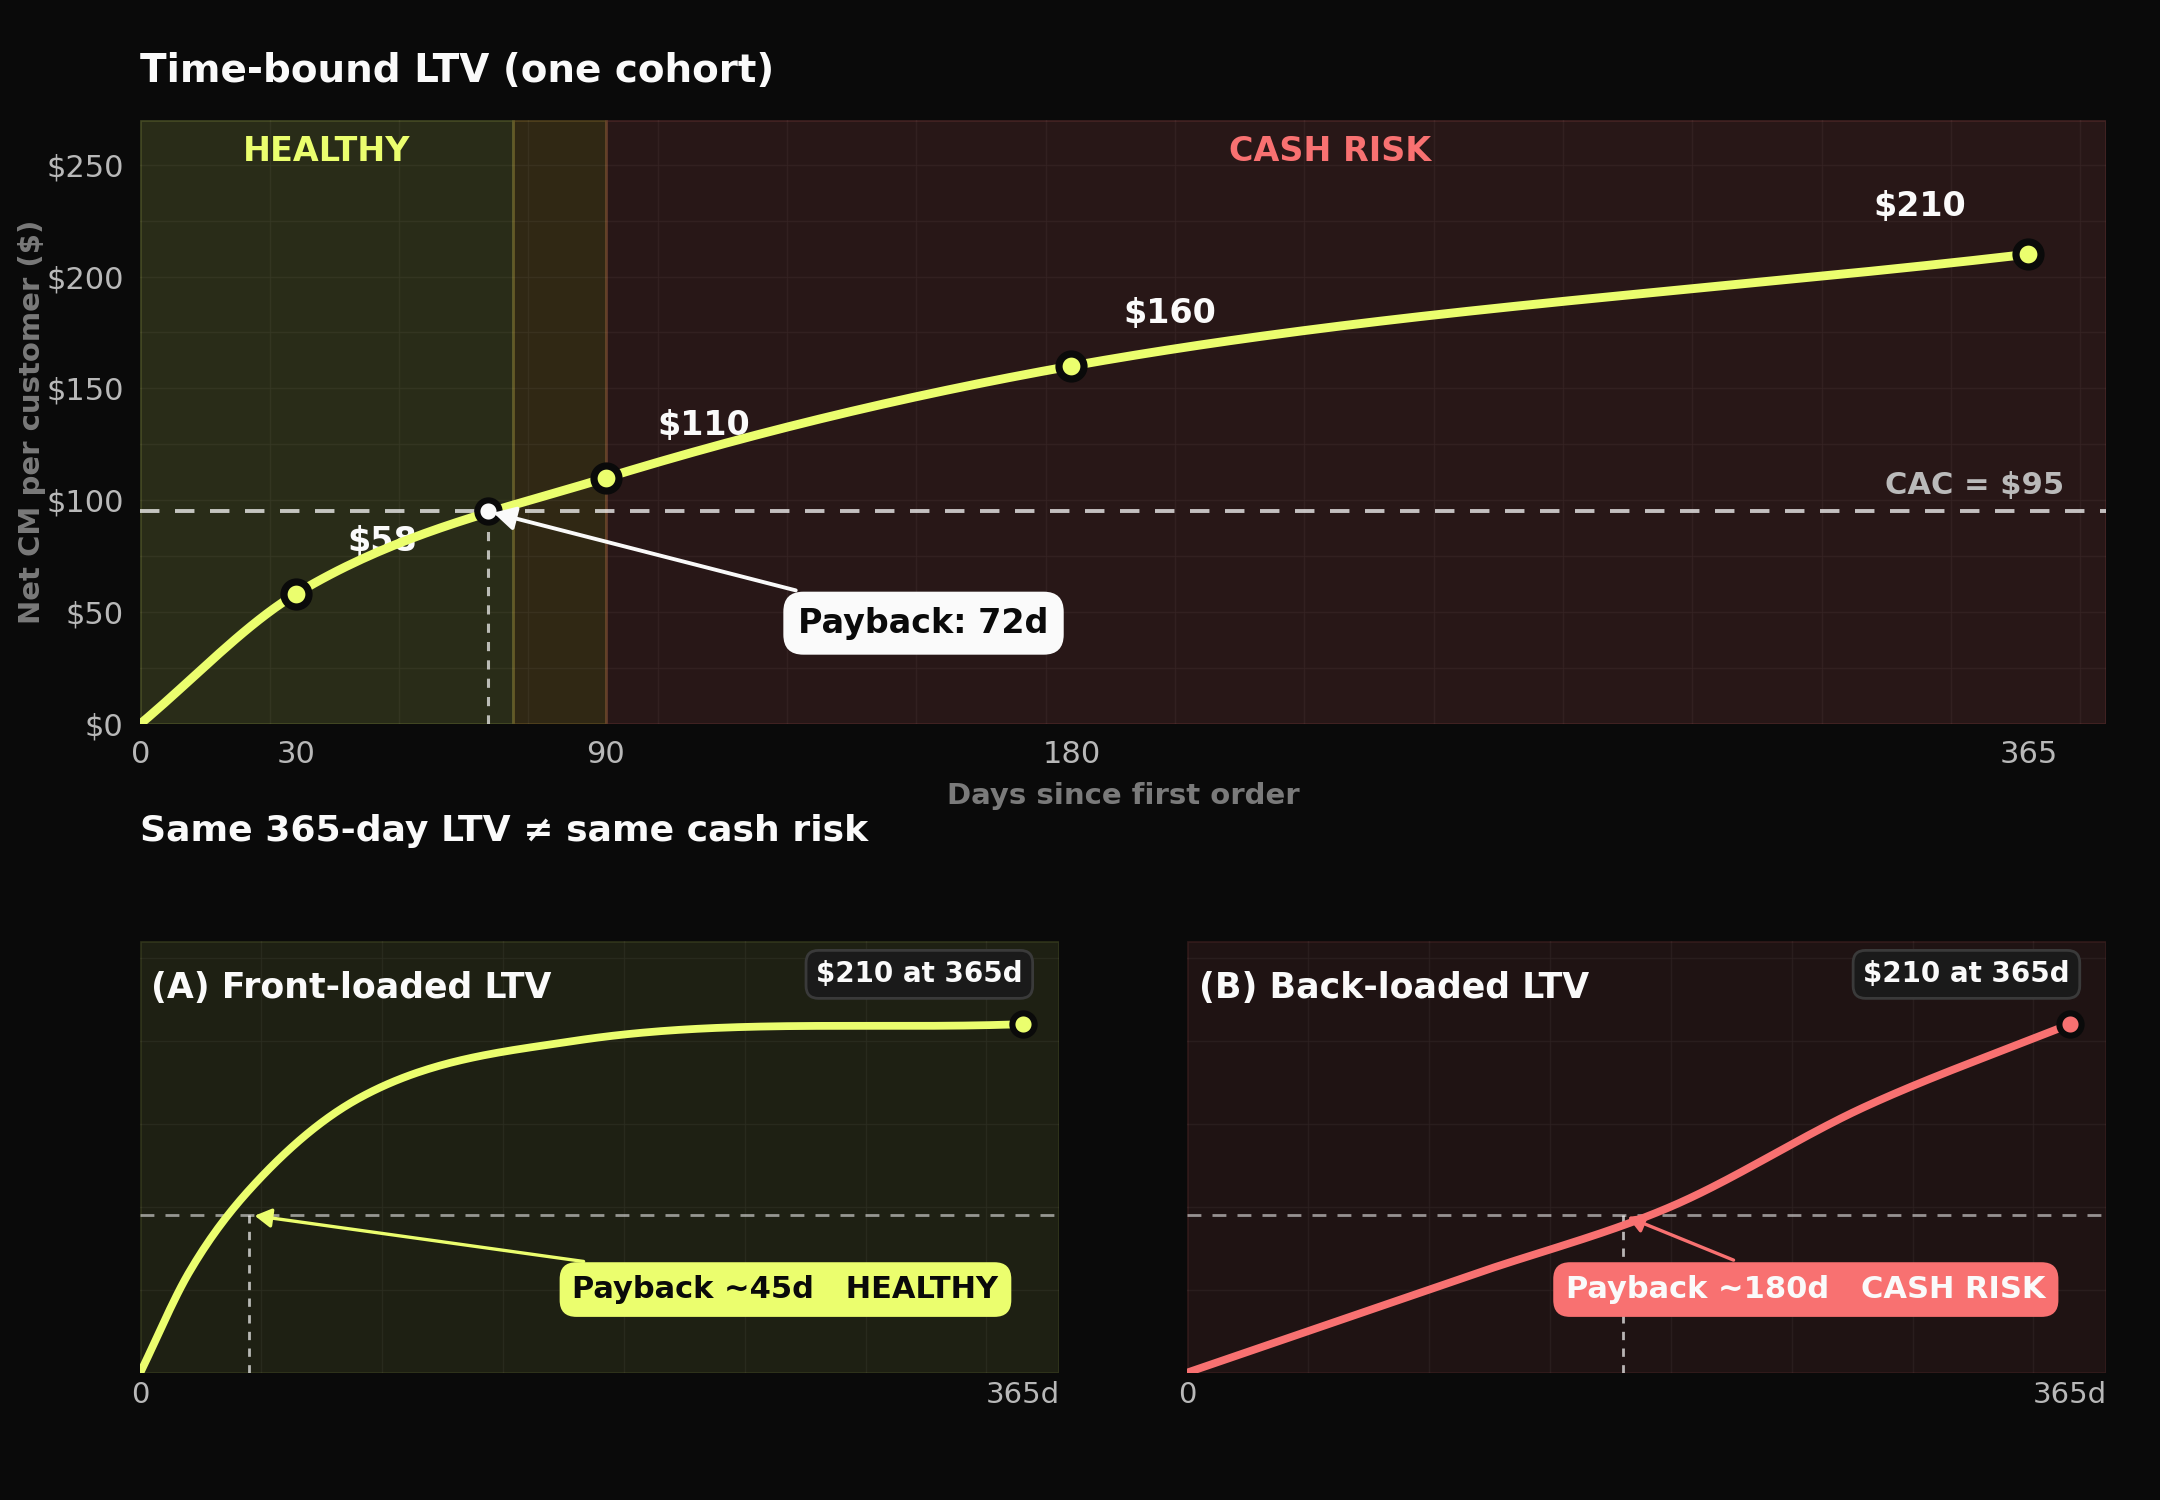
Imagine two cohorts:
Cohort A reaches payback in 45 days
Cohort B reaches payback in 180 days
Both might end at the same 365-day LTV. On paper, they look equal. In reality, they are completely different businesses.
Cohort A helps fund growth. It recycles cash quickly, gives you room to bid, and makes scaling feel controlled.
Cohort B ties up capital, increases financing pressure, and makes every acquisition decision feel riskier than it looked in the dashboard.
That’s why saying “our LTV is $X” without a time frame is not precision. It’s compression. You are collapsing a whole cash-flow curve into one comforting number.
What this changes in how you should think
LTV without time is not a decision metric.
It may be directionally useful, but it is not operational. You cannot set CAC ceilings, judge channel quality, or understand capital efficiency from one blended number. LTV30, LTV90, LTV180, and LTV365 tell you how value accumulates. That accumulation path is what determines whether growth is safe or dangerous.Payback is the bridge between marketing and finance.
Marketing tends to talk about CAC and conversion. Finance cares about cash and margin. Payback connects the two. It forces you to ask: how many days until cumulative contribution margin covers acquisition cost? That is the number that tells you whether a “good” channel is actually scalable.The endpoint hides risk. The curve reveals it.
Two channels can produce the same 12-month LTV and still deserve very different budget decisions. One may be front-loaded with fast repeat, low refund drag, and strong contribution margin. The other may be back-loaded, dependent on discounts, and slow to recover CAC. Same endpoint, very different cash risk.Blended LTV creates false confidence.
The more you blend, the more you hide. New vs returning, channel A vs channel B, hero SKU vs retention SKU, full-price vs promo-led cohorts — these all have different LTV curves. Serious operators don’t ask “what is our LTV?” They ask “whose LTV, over what time window, and how quickly does it pay back?”
The real operator lens
Most brands say they are LTV-driven.
Very few are actually curve-driven.
That’s the difference between seeing value as an abstract future number and treating it as a cash-flow pattern you can manage. Long-term LTV still matters — but healthier scaling comes from understanding how fast that value appears, how reliable it is, and which cohorts actually generate it.
Stop quoting one LTV. Start reporting LTV30, 90, 180, 365, and payback — by cohort and by channel. That is how retention becomes a real economic lever instead of a nice story you tell after the quarter closes.
-Alex
Ask me anything.
Smart questions from operators in my inbox — my honest answers.

If I had to pick three: 30, 90, and 180 days. 30‑day shows immediate quality and early refunds/returns impact. 90‑day is where repeat starts to show up for many brands and becomes a strong payback indicator. 180‑day gives you a clearer view of whether you’re building durable cohorts or just front‑loading revenue.
You can make cross‑channel calls, but you need to compare them on the same time horizon and with context. Short‑lag channels have steep early curves; long‑lag channels start slow but can compound later. I view curves within channel to understand dynamics, then compare channels on a shared window like 180 days (or whatever matches your cash reality). The budget question becomes: which channels create the best profit curve within the window you can afford?
Not always. If your business has a short repurchase cycle, 180 days can already be very predictive. But 365 becomes important when cycles are longer, when product breadth increases over time, or when you’re making bigger strategic decisions (channel expansion, pricing changes, new categories). Think of 365 as the “truth view,” while 30/90/180 are the “steering views.”
Yes — you need comparable cohorts. At minimum, split by acquisition month and tag cohorts by offer context (promo vs non‑promo) so you don’t benchmark a Black Friday cohort against a normal month. I also like separating by entry SKU/category when promos push different products. The goal is to avoid “seasonality illusions” and focus on structural changes in customer quality.
Exactly that: start with a payback constraint based on cash (e.g., CAC must be recovered in contribution margin by day 90 or 180). Then back into a CAC ceiling using the cohort’s profit curve for that channel/segment. It turns CAC from a guess into a constraint tied to reality — and naturally creates different ceilings per channel because their curves mature differently.

 Listen on Spotify