Top-line can go up while the business quietly gets worse. Returns creep up. Discounts become permanent. Shipping and fulfillment inflate. And suddenly the P&L is telling a different story than the Shopify dashboard. If you’re trying to scale an 8–9 figure brand, the only metric that doesn’t lie is contribution margin — because it’s the number that funds your next month of growth.
The story: “Record month" that felt… wrong
A brand hits a record month: up 22% YoY, ads “performing”, the team high-fiving. Then finance drops the bomb: profit is down. Cash feels tighter. The warehouse is overwhelmed. Returns are spiking. Paid is asking for more budget because “ROAS looks healthy," but the CFO’s answer is: “We’re not scaling a dashboard. We’re scaling a business."
What happened? Nothing dramatic. Just death by a thousand cuts:
Promo depth increased slightly to keep conversion “stable."
Shipping costs rose and the brand ate more of it.
A hero product drove volume… and also drove returns.
More first-time customers came in through discount-led entry SKUs and didn’t repeat.
Revenue told a feel-good story. Contribution margin told the truth.
Contribution Margin Reality Check
Revenue is an opinion.
Contribution margin is fact.
CM1 by cohort × product × acquisition source — with drivers and next actions.
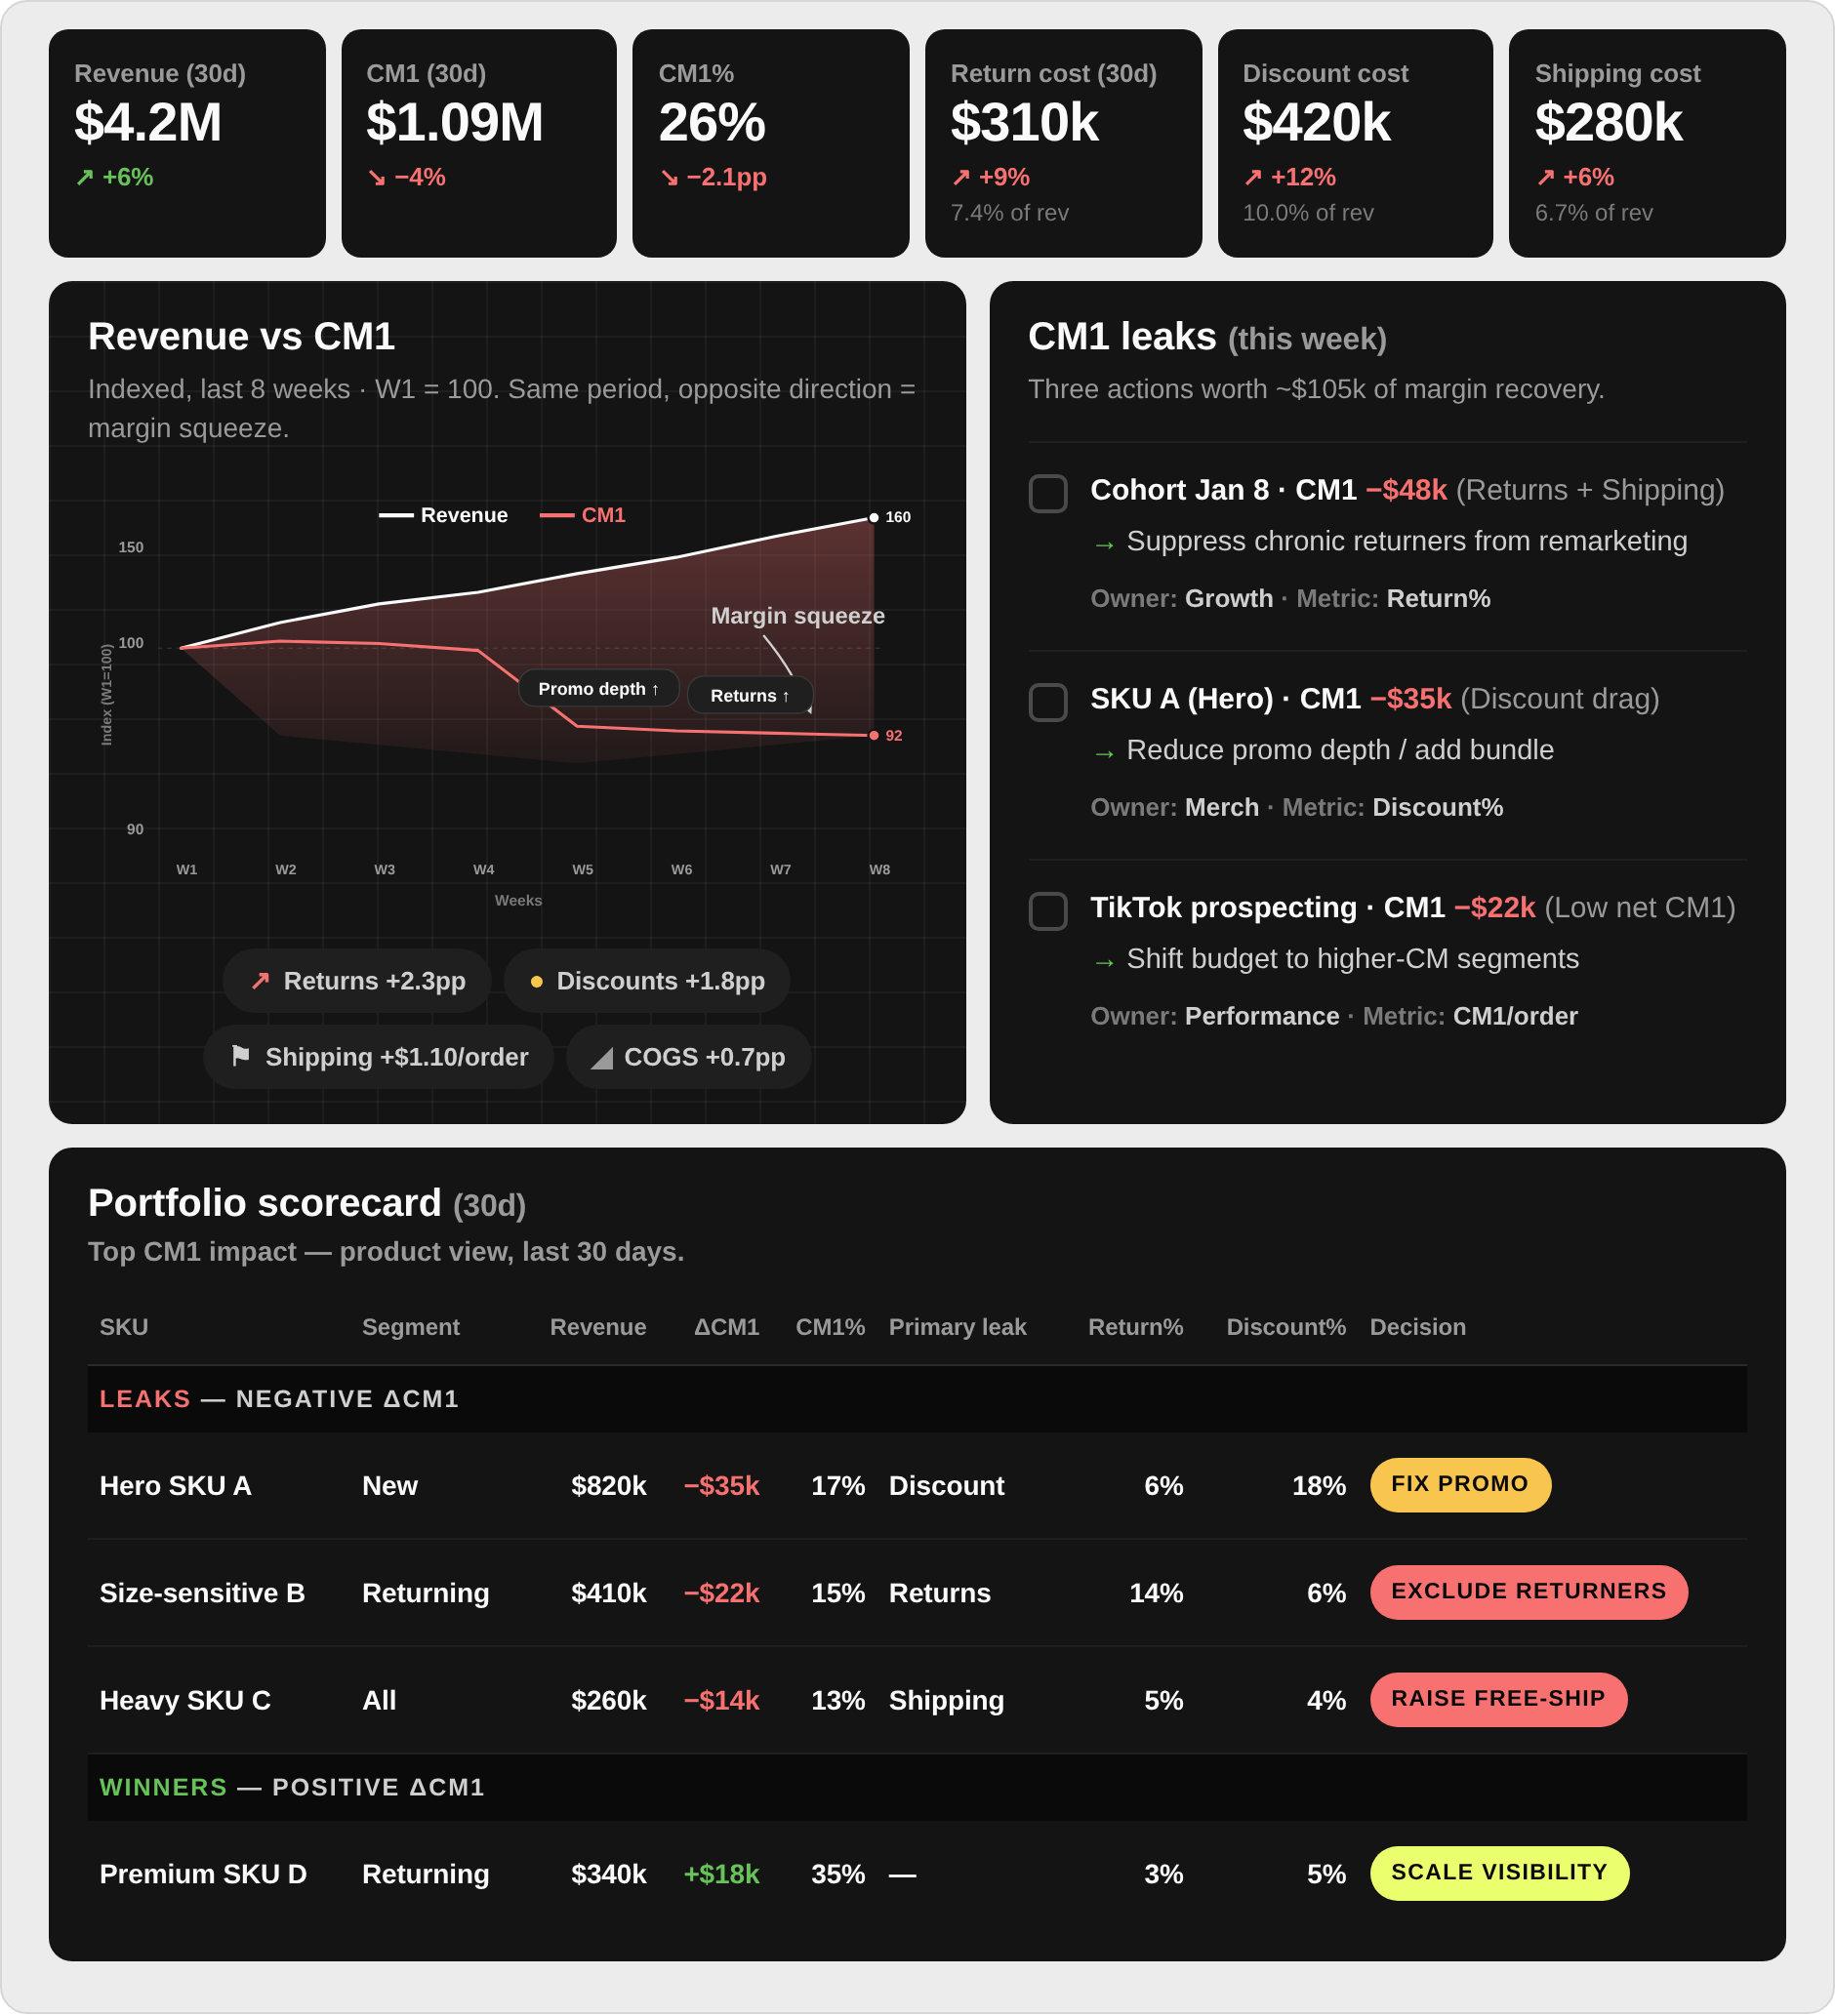
Decision rule: Scale what grows CM1. Fix the leak driver before scaling spend.
The fastest way a brand drifts into a cash problem is when marketing celebrates ratio improvements while finance is staring at payback reality.
Because platforms can show “better ROAS" even when the underlying economics got worse:
you pulled demand forward with a deeper promo,
you bought cheaper conversions through low-quality entry SKUs,
and suddenly the P&L is funding growth with patience instead of profit.
This is why I want you to track CM payback by cohort — not just ROAS.
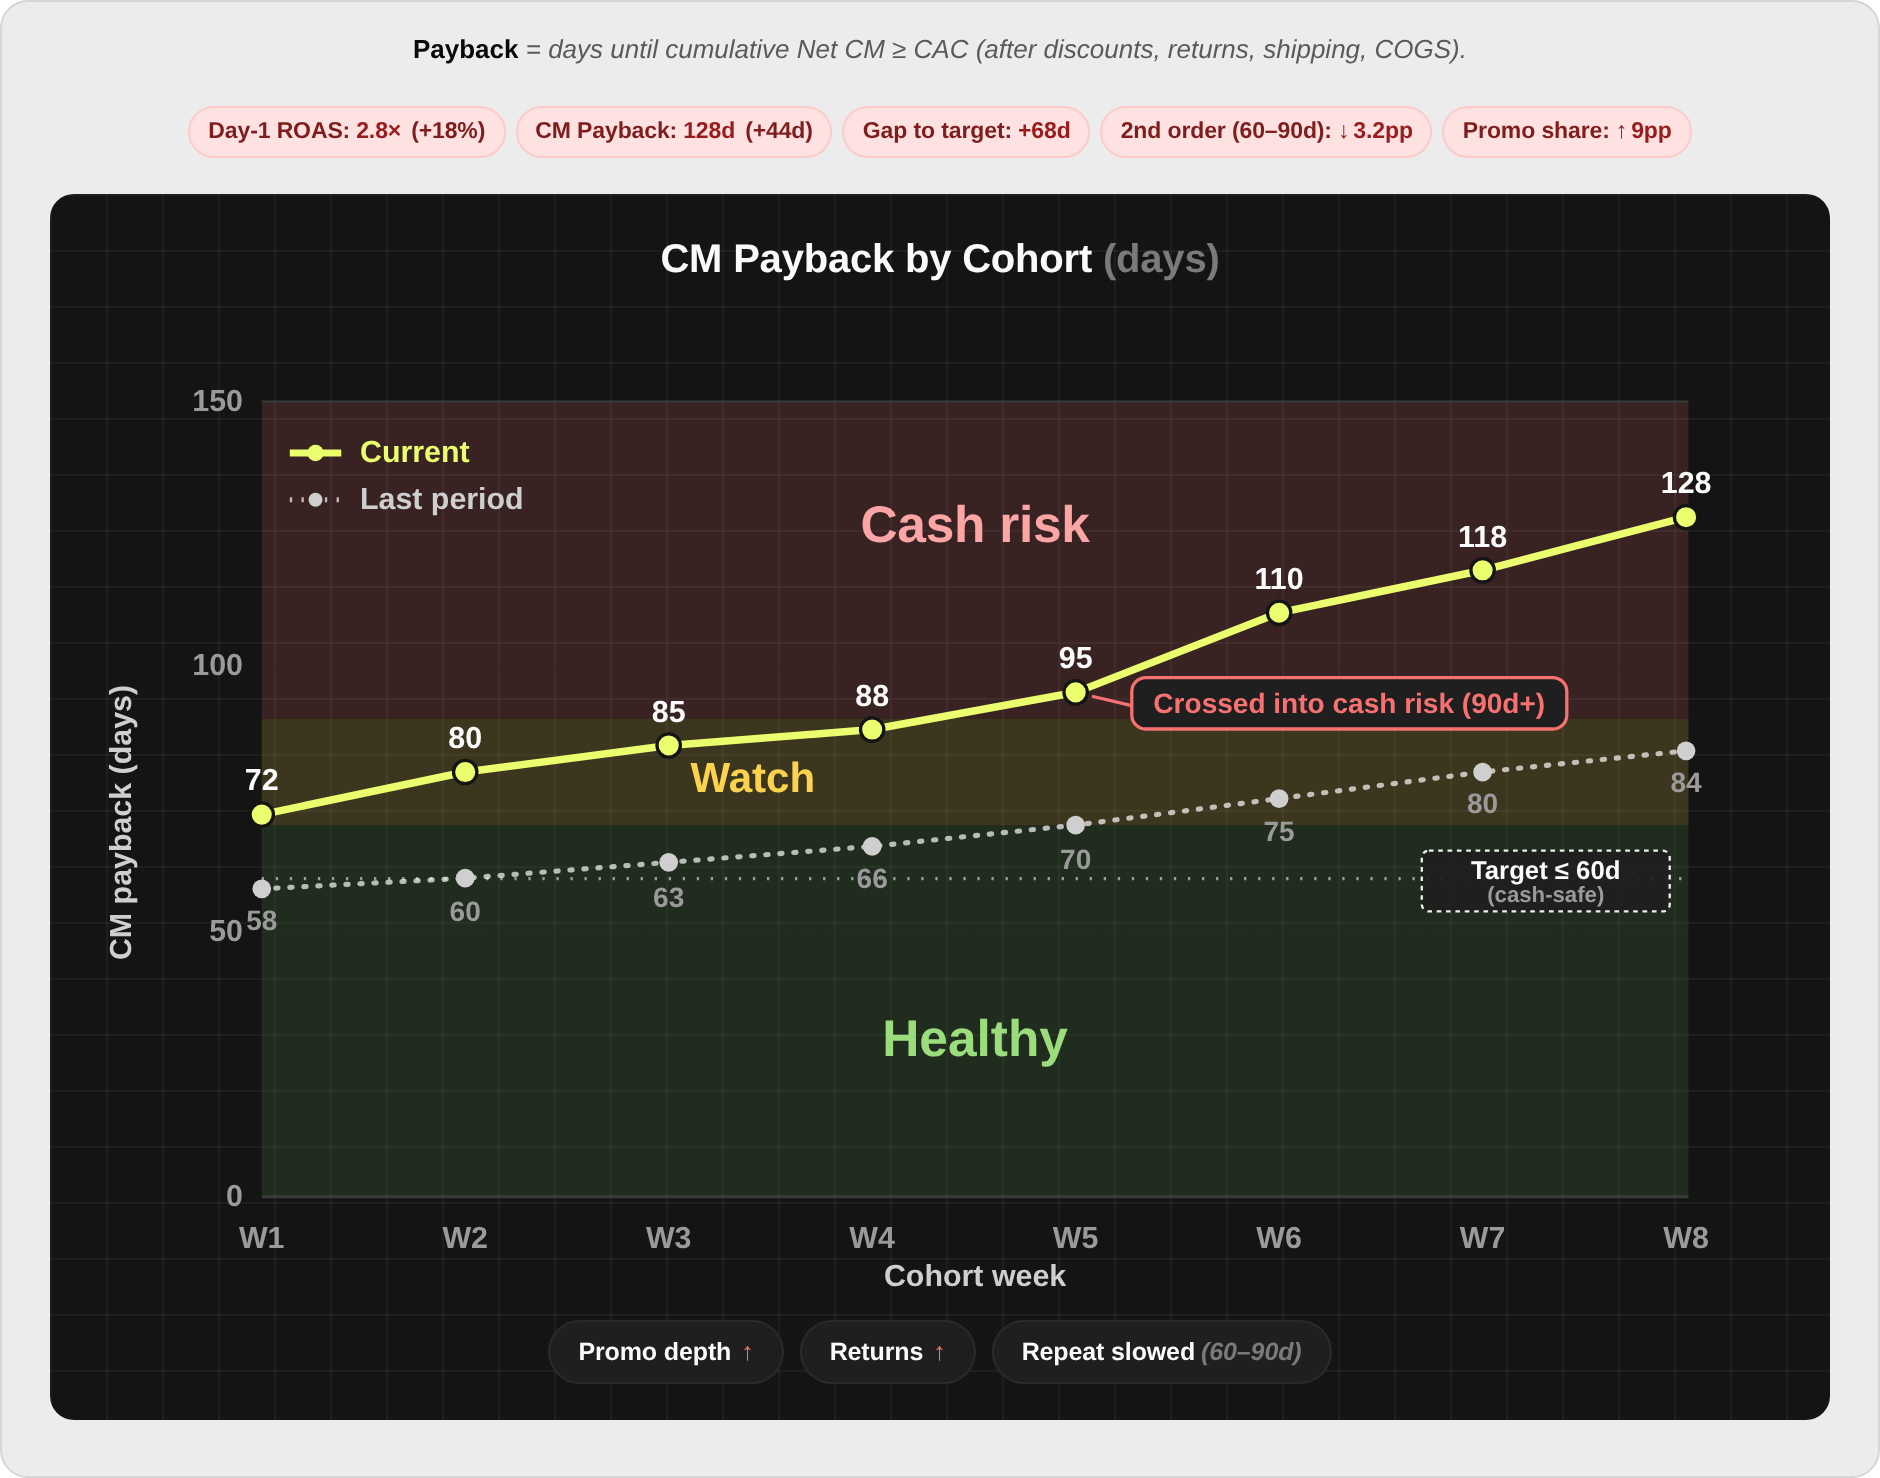
Payback = days until cumulative net contribution margin ≥ CAC (after discounts, returns, shipping, COGS).
Cohort Payback · Reality Check
‘ROAS went up’ is the most expensive
sentence in ecommerce.
CEO metric: CM payback by cohort (compression, not ratios).
If payback doesn’t compress, performance didn’t improve.
Look at what this chart is really saying:
Day-1 ROAS is up — the platform looks healthier.
CM payback is now 128 days — the business is less cash-safe.
You’ve crossed from Healthy (≤60d) into Watch (60–90d) and into Cash risk (90d+).
And the killer part: the chart points to why:
Promo share ↑: you “bought" revenue by giving up margin.
2nd order rate (60–90d) ↓: the repeat backbone is flattening.
Returns ↑: the cost shows up later, not on day 1.
So the exec-level question is never “Did ROAS go up?"
It’s:
Did payback compress — and if not, what lever broke (promo, returns, repeat timing, product mix, channel mix)?
That one shift changes your weekly meeting from a debate about whose dashboard is right into an operator conversation about what to fix next.
4 principles that change how you run the business
Revenue is a lagging indicator of decisions you already made.
Your P&L today reflects promo strategy, product mix, channel mix, and fulfillment choices from weeks ago. If you only look at revenue, you’re steering by the wake. CM1 is steering by the engine.
The same revenue can be “good" or “toxic" depending on who it came from.
A cohort acquired through a discount-led entry product can look amazing on day 1 and bankrupt you by month 3. Why? Because the hidden costs show up later: returns, low repeat, higher support load, and perpetual promo dependence.
Products don’t just create sales — they create customer types.
Some SKUs attract loyal, high-AOV repeat buyers. Others attract deal tourists and chronic returners. If you don’t see contribution margin and repeat behavior by first product purchased, you’re funding the wrong future.
Blended metrics hide the leak.
Blended ROAS, blended CAC, blended AOV — they smooth out the truth. The leak is always concentrated: one product, one offer, one acquisition source, one segment. The job is to find the leak and fix it, not average it away.
|
✓
|
|
The Operator Playbook
|
| What to do next |
| Moves that immediately improve decision quality — without changing your entire stack. |
|
|
|
|
Define CM1 like a grown-up (and make it non-negotiable).
| • |
Revenue (net of discounts) |
| • |
COGS |
| • |
Shipping / fulfillment costs (and shipping subsidies) |
| • |
Payment fees |
| • |
Returns / refunds (and return handling costs if you track them) |
That’s the number you should optimize for. Not revenue. Not “platform revenue.”
|
|
|
Build three CM1 views that should exist in every weekly exec meeting.
| • |
CM1 by cohort: are newer cohorts healthier or worse than last quarter? |
| • |
CM1 by acquisition source: which channels actually fund growth after costs? |
| • |
CM1 by product (and by entry product): which SKUs generate profitable customers vs expensive ones? |
If you only do one thing, do this. It turns gut-feel debates into mechanical decisions.
|
|
|
Stop buying revenue. Start buying profitable cohorts.
Change your media brief from “Hit a CAC target” to “Hit CM1 payback by month X” and “Hit LTV:CAC by month Y.”
You’ll instantly stop scaling campaigns that look good in-platform but don’t create profitable customers.
|
|
|
Make promo strategy accountable to CM1, not conversion rate.
Promos are not “marketing.” They are margin allocation.
| • |
CM1 per order at each promo depth |
| • |
Return rate by promo depth |
| • |
Repeat purchase rate by promo depth |
You’ll usually find the uncomfortable truth: the promo that “saved conversion” also trained worse cohorts.
|
|
|
Demote toxic volume fast.
Once you see CM1 by product and by acquisition source, you’ll find culprits like:
| • |
High-return “hero” products |
| • |
Channels that over-index on low-margin customers |
| • |
Offers that spike orders but destroy payback |
The operator move is ruthless: cap spend, change the offer, change the entry SKU, or change the landing experience.
|
|
|
BOOK YOUR AUDIT →
|
|
Why this becomes a compounding advantage
When you run the business on contribution margin, three things happen:
You stop scaling problems that are disguised as growth.
You start building a customer file that pays you back faster.
Your team aligns because there’s one reality.
That’s the difference between brands that “grow" and brands that compound.
Summary
Revenue can be manipulated by timing, promos, and attribution. Contribution margin cannot. If you want to scale without turning the business into a promo treadmill, you need CM1 by cohort, by product, and by acquisition source — so you can invest in the customers and SKUs that actually fund your next 12 months.
And this is exactly where most stacks break: the data needed for CM1 lives in different places (Shopify, returns, shipping, ads, ESP), so teams end up debating whose number is “right" instead of making decisions.
RetentionX makes CM1 operational by stitching the customer, product, and acquisition story together into one view — so you can see which cohorts are profitable, which entry products create the best customers, and which channels are buying margin vs buying noise.
|
Reader questions
|
| Ask me anything. |
| Smart questions from operators in my inbox — my honest answers. |
|
|
What do you include in CM1? |
|
|
|
|
Alex says · Founder RetentionX |
|
| At minimum: revenue − COGS − shipping/fulfillment costs − payment fees, net of discounts. If you can, include expected returns/refunds (or actual returns once they mature), because that’s often the hidden killer. The point is to measure profit that scales with volume, not accounting allocations. CM1 should be consistent and comparable across cohorts/products/channels. |
|
|
|
How do you recommend handling blended fixed costs when teams start living in CM1? Some founders push back because it “ignores overhead,” but marketing needs a decision metric that doesn’t turn into accounting theater. |
|
|
|
|
Alex says · Founder RetentionX |
|
| Use CM1 for operating decisions because it’s the cleanest variable profit signal. Then separately track a simple guardrail like CM1 − CAC and payback period, so you know whether growth is funding overhead over time. Overhead matters, but allocating it per order usually creates more debate than insight. The founder/CFO view should be: CM1 is the engine, overhead is the load — first make sure the engine is getting stronger, then decide how much load you can carry. |
|
|
|
In categories with high return rates (fashion) or volatile shipping (bulky goods), do you compute CM1 after expected returns (using historical return probability) or only after returns actually happen? Curious what’s most useful for making acquisition and merchandising calls in real time. |
|
|
|
|
Alex says · Founder RetentionX |
|
| For decision-making, I prefer CM1 with expected returns using historical return rates by SKU / category / size / profile. Otherwise you’re flying blind in the window where you’re spending money and scaling. Then you reconcile to actual returns later to keep it honest. This gives you a near-real-time profitability signal and prevents you from scaling “revenue” that’s mostly future refunds. |
|
|
|
How do you keep teams from gaming CM1 the same way they game ROAS? For example, cutting prospecting, over-prioritizing repeat buyers, or suppressing growth investments that have longer payback but create better cohorts. |
|
|
|
|
Alex says · Founder RetentionX |
|
| You pair CM1 with cohort health and growth guardrails: new customer volume, payback targets, and 90 / 180-day profit per new customer. If CM1 improves but new cohorts shrink or long-term profit per new customer deteriorates, you’ve just optimized the present. The scorecard should reward building a stronger customer base, not just harvesting the existing one. Good metrics are a portfolio, not a single number. |
|
|
|
When you say “CM1 by acquisition source,” what’s the cleanest attribution approach you’ve seen that doesn’t collapse into a fight? First-touch, blended, weighted, cohort-based? Especially when customers touch 5–7 channels before buying. |
|
|
|
|
Alex says · Founder RetentionX |
|
| The most practical approach is cohort-based channel grouping: assign each new customer to a primary acquisition source using a consistent rule (often first-touch or a defined weighting), then judge that channel by the profitability of the cohorts it creates over 90 / 180 / 365 days. You’re not trying to perfectly “credit” every touch — you’re asking which channels reliably produce profitable customers. That reduces politics because the outcome is downstream profit, not attribution perfection. Channels can still be optimized tactically with attribution, but budget gets allocated based on cohort CM1. |
|
|


 Listen on Spotify